/
Zoomable Timeline
Zoomable Timeline
Since Gantt-Chart version 3.2, a zoomable timeline at the top of the Gantt diagram is available for:
- fast horizontal scrolling
- flexible, automatic scaling between daily, weekly, monthly, quarterly, yearly view
What's displayed within the zoomable timeline?
- date 1. within the sample screenshot below displays the minimum planned start date of all selected issues
- date 2. displays the maximum planned end date of all selected issues, both together determine the overall duration
- date a. shows the most left displayed day on the current screen
- date b. shows the most right displayed day on the current screen, both together determine the visible time frame
Steps to work with the zoomable timeline
- Extend the timeline by selecting other start/end dates:
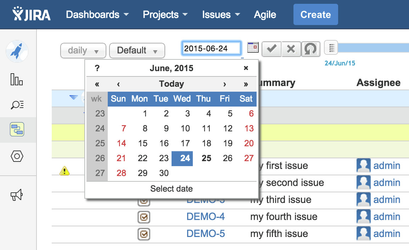
move the mouse over the related date figure and click on the pencil icon to start editing.
You can click into the input field to enter the explicit date manually and finish by typing ENTER or click on the icon "okay". To cancel, just click on the related icon right to okay. Having set another date before, you can click on the icon "rollback" to use the standard again overwriting your prior date input.
Alternatively, click on the icon "calendar" and select your preferred date.
Having set a new width of timeline, the screen is updated accordingly.
- Move left/right slider to resize the visible time frame: the related timestamp will be updated immediately in real-time. The blue part of the timeline illustrate the time frame being displayed on the current screen using the current time unit, here: daily. The best suitable time unit will be determined automatically to fit the selected duration into the displayed area.
, multiple selections available,
Related content
Planning Dates without displaying time part (dates only)
Planning Dates without displaying time part (dates only)
More like this
Gantt-Chart for agile Planning
Gantt-Chart for agile Planning
More like this
New Gantt-Chart Releases
New Gantt-Chart Releases
More like this
Gantt-Chart for JIRA Release 4.3.x
Gantt-Chart for JIRA Release 4.3.x
More like this
Gantt-Chart for JIRA Release 4.2.x
Gantt-Chart for JIRA Release 4.2.x
More like this
Gantt-Chart for JIRA Release 4.1.x
Gantt-Chart for JIRA Release 4.1.x
More like this


