Resource Planning
- Frank Polscheit (PSIT)
Step-by-step guide
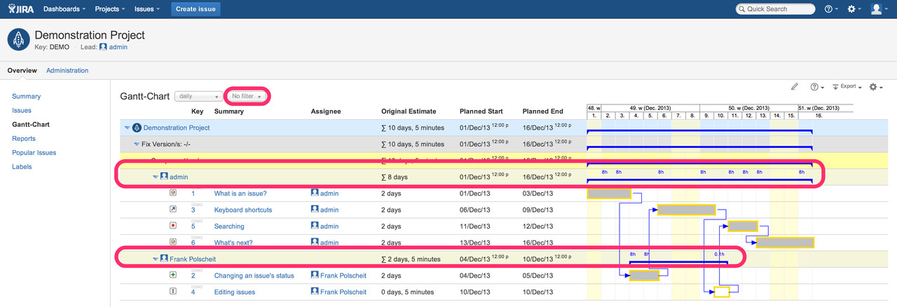
- use the default for issue selection ("Default") or
- any favorite filter having an ORDER BY clause containing "assignee" or
- click on Gantt menu item "configure columns & rows", switch to tab "grouping rows", enable option "Group by columns below instead of auto-grouping based on ORDER-BY-clause of related JQL" and take care to have added at least column "assignee" beside all other columns you want to group by and hit finish (since Gantt-Chart version 3.2: this feature is also available for agile SCRUM boards as well as Kanban board selections).
In all cases above:
- if you use loading by scrolling down, the assignee's utilization will be calculated and displayed reaching another assignee or end of issue selection (otherwise, you would aggregate incomplete list of issues resulting in wrong numbers)
- in blue color at the top of each row, you will see the aggregated sum of estimated efforts per time unit (daily, weekly, monthly, quarterly, yearly), whereas you will see the aggregated sum of remaining estimated efforts at the bottom in black color or in red, if the related daily amount of working hours has been exceeded. The daily amount of working hours can be configured within JIRA natively (see Atlassian docu).
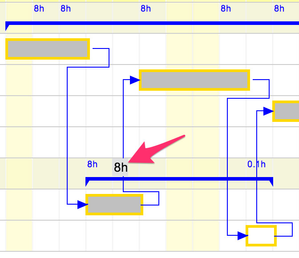
The utilization figures are rounded to one digit after the comma – if necessary – and displayed using a font size of 10px:
if that's to small to be read comfortably, move the mouse over the related figure and the number will be enlarged automatically for better readability
4. You can easily (re-)assign issues to other team members: ensure that you have configured the Gantt-Chart to display the assignee column (Gantt menu - configure columns & rows - tab "columns") and that you have enabled edit mode by clicking on the pencil icon (1). Then click on the assignee field (2) rather than by drag'n drop:

Then select your preferred project role and then the related assignee: rather than just selecting the assignee by name, you can focus on project roles like selecting all project's developers or tester etc., too. Then select a role member of the sub-list based on the chosen project role as new assignee. For sure, alternatively you can just select from all assignable users as well:


Having assigned issues to different team members, you can switch from the view above (agile board of JIRA Agile) to the default Gantt-Chart view, grouping by assignees beside other configurable aspects:

If you collapse rows of assignee, you'll get a nice overview of your team:

Per assignee row, you'll see within a single row containing all related issues, which may overlap (assignment of multiple issues to a team member in parallel). Issues are display in semi-transparency, so it becomes darker if more issues overlap each other to indicate multi-work per time unit.
Gantt-Chart versions prior to v3.0.1 have got a separate project tab panel for displaying a view for resource planning. Since v3.0.1, this has been integrated for more flexibility.
Since Gantt-Chart version 3.2, you have the ability of selecting a project role upfront to a role member.
Related articles