Export to SVG, PDF, Excel and MS-Project
- Frank Polscheit (PSIT)
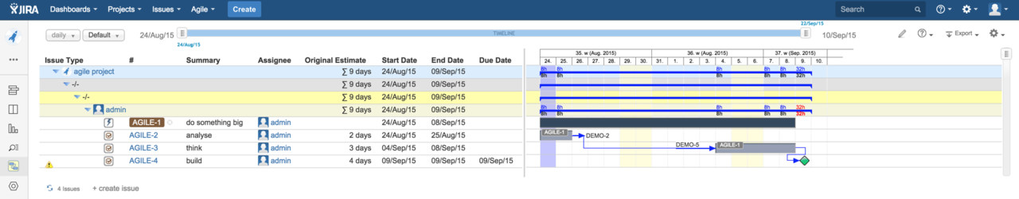
The following JIRA sample is used for illustrating the various options for exporting to Mircosoft Powerpoint and Excel: here, one EPIC and three issues.
Export to SDG and PDF
Export to MS-Excel
As the amount of columns within Excel is limited to 256 columns, it is not possible to display a timeline per day (just 256 days would be too small for a lot real projects).
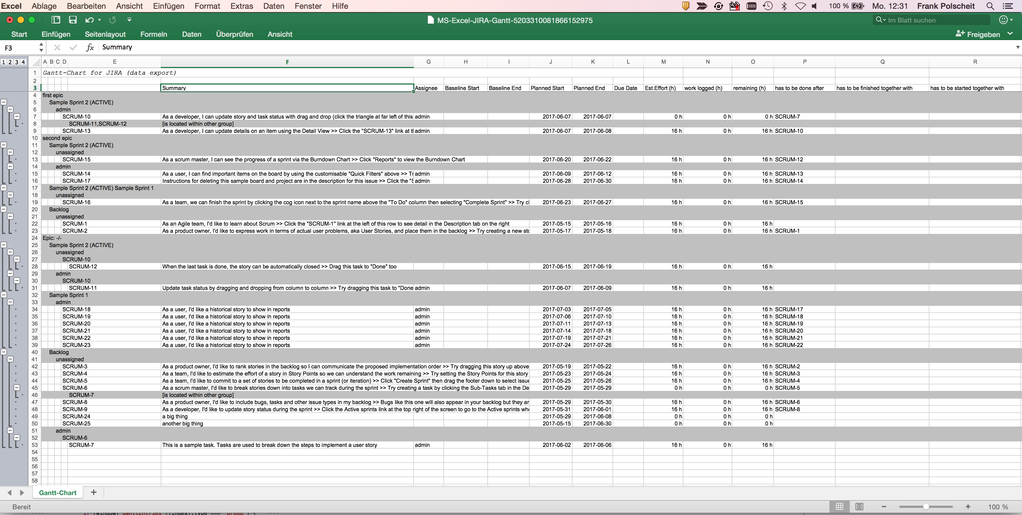
Though, a semi-graphical illustration cannot be done properly within Excel. The core data are exported and issue dependencies are represented by the JIRA internal IDs of the related issues as explained below.
Additionally, the multi-level issue hiearchy will be fully maintained:
Export to MS-Project
An export to MS-Project is available via Mircosoft's XML-File format. Nevertheless, both concepts - JIRA and MS-Project - are very different in details. So, within JIRA the planned start and end date determines a duration in time. The estimated effort is totally independent from that. You can use this e.g. for part-time working etc. Within MS-Project, the duration will be automatically calculated and per default one day of effort is always one day of duration. That differences will be explained by using the following JIRA issues having a 4-level WBS (see TEST-2 and its 3 levels of subtasks: TEST-4 → TEST-5 → TEST-6). This WBS is created by using the Gantt-Chart feature of multi-level issue hierarchies. Natively, JIRA can only have parent tasks and one level of subtasks.
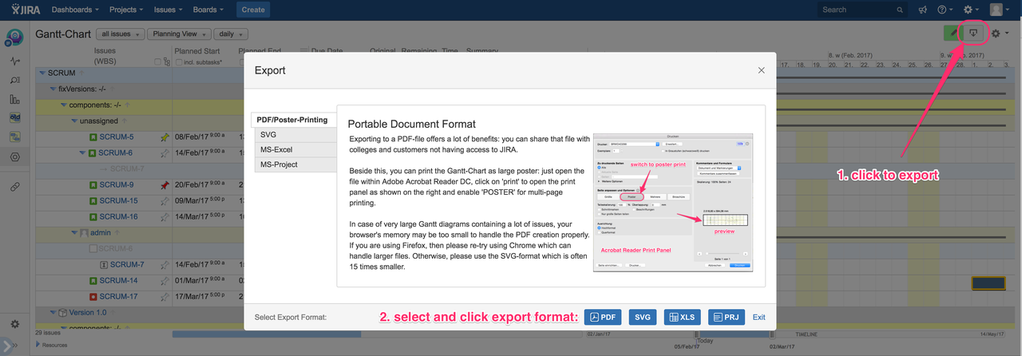
Click on menu item "MS-Project" of "Export" to generate a XML-file containing your issues as selected for the Gantt-Chart within JIRA. This XML-file will be downloaded automatically. Please open it using MS-Project as displayed below:
If you would export that issues into MS-Project setting each task to "AutoSchedule", the planning periods will be totally different. The screenshot has been done before inserting issue TEST-5 and TEST-6 into JIRA to focus on this circumstance. MS-Project and JIRA are not semantically treating issues in the same way: a summary issue within MS-Project is just that, whereas it can have its own estimated efforts etc. like all other issues within JIRA. Additionally, it starts too early within JIRA, but this is indicated by the red dotted dependency to TEST-2: it is a topic of the project manager to decide, what to do (whether to shift TEST-2 into the future or split TEST-1 to be ready in time etc.)
In order to avoid such differences between JIRA and MS-Project, all tasks are set to "Manually Schedule" within MS-Project: see marked "Task Mode" within the screenshot below. The planning dates fit to JIRA, now. Whereas the duration within MS-Project is correct using this sample, I have seen test data sets having wrong durations being displayed within MS-Project although all duration values within the provided XML-file are correct. That's a topic of MS-Project, which I cannot fix other than guarantee proper export XML data ...
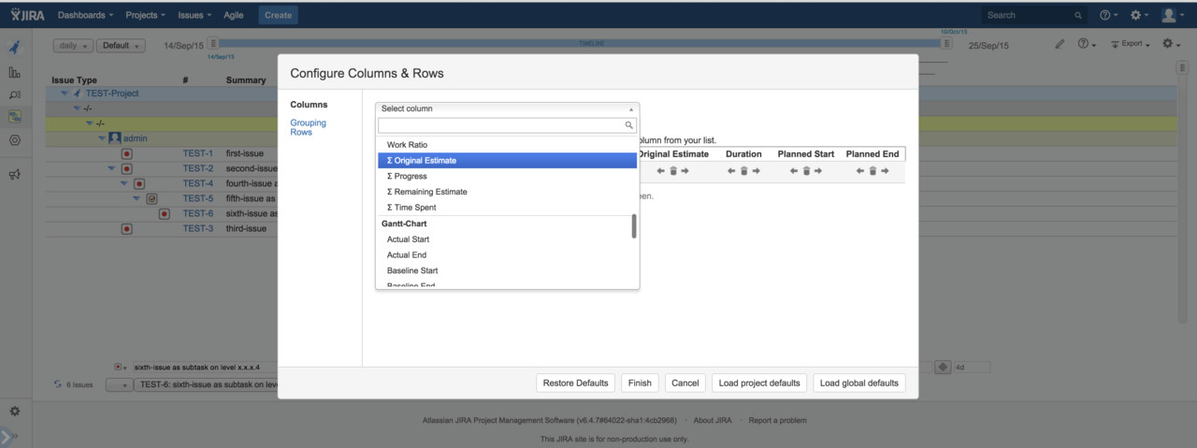
The "Work" columns contains ∑ work of the main task and all subtasks (3 + 5 + 3 + 4 = 15 days of estimated effort within JIRA * 8h/day = 120hrs as displayed for TEST-2/second-issue). Within the Gantt-Chart for JIRA, the column "Original Estimate" just displays that per single issue. If you want to see the accumulated work of all subtasks, please add column "∑ Original Estimate" via Gantt menu item "configure columns & rows". Nevertheless, you have to add the main task's work to this sum of subtasks' work to get the same value as displayed within MS-Project.
The following information will be exported to MS-Project:
set Name
- set JIRA's issue key into the Notes field
- set Hyperlink to each JIRA issue
set Milestone
set Estimated
set Work
set RemainingWork
set PercentageComplete
set Start
set Finish
- set Deadline (due date)
- set Dependencies