Performance
- Frank Polscheit (PSIT)
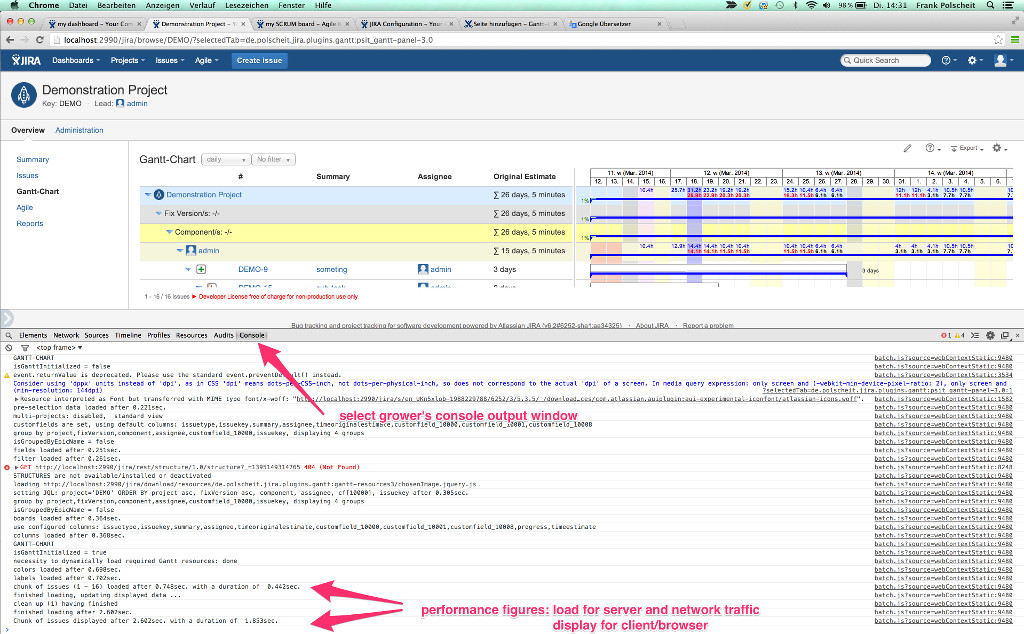
Within your browser, you can see end-to-end as well as loading performance figures. Please proceed as documented below, depending on the browser you are using.
Within an optimized JIRA infrastructure based on high-performance server with fast SSDs, you can load 1.000 issues within less than 3 seconds.
Load times depend on the performance of your JIRA server as well as database server. If your JIRA delivers chunks of issues (by default 50 issues per request, the last one can be less) too slow to the browser, the Gantt-Chart addon cannot display them faster.
Open your browser's console:
Browserhow to open the console windowGoogle Chrome hit  on an Apple MAC / OSX or click on the browser's menu on the top right, select menu item "Tools" and choose sub-menu item "dev. tools"
Apple Safari hit 
Mozilla Firefox use the free add-on "FireBug" (you have to manually install this add-on into your Firefox) Microsoft IE10/11 hit keystroke "F12" - Select tab "Console", which can vary depending on your browser
To give you another benchmark for comparing your own JIRA environment with a typical hosted scenario: a virtual server by hosteurope.de needs less than 10 sec. to retrieve and display 1000 issues.
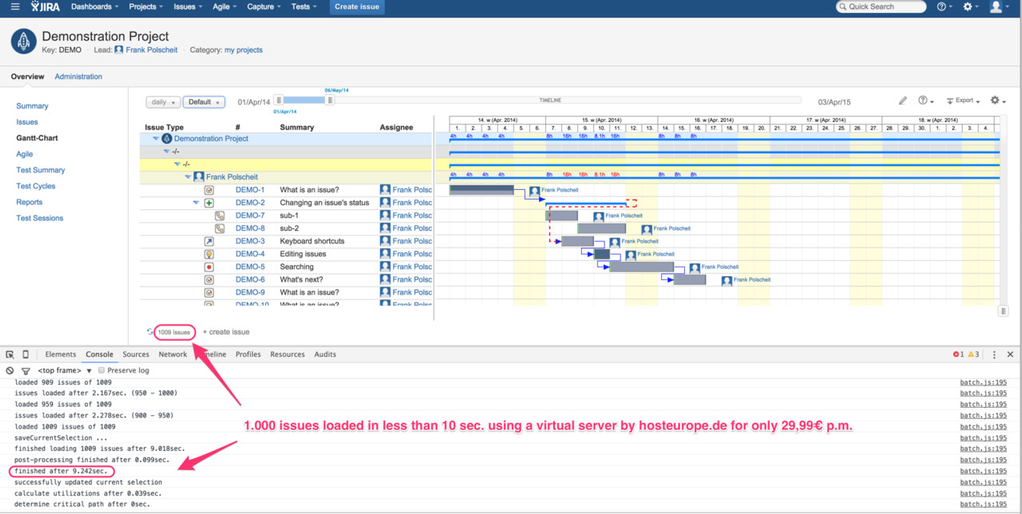
The complete console output is listed below: as you can see, the average load time for a chunk of 50 issues is about 2 seconds. To reach the goal of loading more than 1000 issues in less than 10 seconds (almost 9 sec.), I am loading 6 chunks in parallel. Therefore, please ensure that you have enabled connection pooling for your database server and enough parallel requests configured.
My Environment:
JIRA Version: 6.2.1#6256
Gantt-Chart Version: 3.2.6-JIRA6_2015-10-25T16-51-41Z
Gantt-Chart has already been defined but is not initialized yet while loading ...
GANTT-CHART
initialize gantt ...
JIRA baseUrl: https://lvps87-230-23-121.dedicated.hosteurope.de/jira
request URL : https://lvps87-230-23-121.dedicated.hosteurope.de/jira/browse/DEMO/
used browser: Chrome version 47
filter loaded after 0.059sec.
STRUCTURES are not available/installed or deactivated
pre-selection data loaded after 0.066sec.
multi-projects: disabled, standard view
customfields are set, using default columns: issuetype,issuekey,summary,assignee,timeoriginalestimate,customfield_10100,customfield_10101,customfield_10108
actual start date: 'Actual Start' (customfield_10500)
actual end date: 'Actual End' (customfield_10600)
planned start date: 'Planned Start' (customfield_10100)
planned end date: 'Planned End' (customfield_10101)
baseline start date: 'Baseline Start' (customfield_10105)
baseline end date: 'Baseline End' (customfield_10106)
date of baselining : 'Date of Baselining' (customfield_10601)
baseline effort : 'Baseline Effort' (customfield_10501)
Gantt options : 'Gantt Options' (customfield_10104)
group by project,fixVersions,component,assignee, displaying 4 groups
isGroupedByEpicName = false
fields loaded after 0.105sec.
Gantt dependency: use 'Gantt: finish-finish' (has to be finished together with -> inward | outward -> has to be finished together with) for finish-finish
Gantt dependency: use 'Gantt: finish-start' (has to be done after -> inward | outward -> has to be done before) for finish-start
Gantt dependency: use 'Gantt: start-finish' (is triggered by -> inward | outward -> is triggering) for start-finish
Gantt dependency: use 'Gantt: start-start' (has to be started together with -> inward | outward -> has to be started together with) for start-start
group by project,fixVersions,component,assignee, displaying 4 groups
isGroupedByEpicName = false
group by project,fixVersions,component,assignee, displaying 4 groups
isGroupedByEpicName = false
setting JQL: project = MACS after 0.123sec.
colors loaded after 0.163sec.
use hierarchy link id = 10504 overwriting individual setting!
labels loaded after 0.166sec.
columns loaded after 0.168sec.
set columns = default columns (issuetype,issuekey,summary,assignee,timeoriginalestimate,customfield_10100,customfield_10101,customfield_10108)
use default grouping or as specified within ORDER BY clause of JQL
read agile boards
boards loaded after 0.191sec.
current user has edit permission
current user has scheduling permission
group by project,fixVersions,component,assignee, displaying 4 groups
isGroupedByEpicName = false
setting JQL: after 0.008sec.
saveCurrentSelection ...
use configured columns: issuetype,issuekey,summary,assignee,timeoriginalestimate,customfield_10100,customfield_10101,customfield_10108
columns loaded after 0.031sec.
display summaries as multilines: false
use default grouping or as specified within ORDER BY clause of JQL
labels loaded after 0.061sec.
colors loaded after 0.062sec.
successfully updated current selection
issues loaded after 2.313sec. (200 - 250)
loaded 50 issues of 1009
issues loaded after 2.45sec. (0 - 50)
loaded 100 issues of 1009
issues loaded after 2.503sec. (50 - 100)
loaded 150 issues of 1009
issues loaded after 2.668sec. (150 - 200)
loaded 200 issues of 1009
issues loaded after 2.717sec. (100 - 150)
loaded 250 issues of 1009
issues loaded after 2.877sec. (250 - 300)
loaded 300 issues of 1009
issues loaded after 2.019sec. (300 - 350)
loaded 350 issues of 1009
issues loaded after 1.993sec. (350 - 400)
loaded 400 issues of 1009
issues loaded after 2.163sec. (400 - 450)
loaded 450 issues of 1009
issues loaded after 2.171sec. (550 - 600)
loaded 500 issues of 1009
issues loaded after 2.337sec. (500 - 550)
loaded 550 issues of 1009
issues loaded after 2.427sec. (450 - 500)
loaded 600 issues of 1009
issues loaded after 2.113sec. (600 - 650)
loaded 650 issues of 1009
issues loaded after 2.029sec. (650 - 700)
loaded 700 issues of 1009
issues loaded after 2.257sec. (700 - 750)
loaded 750 issues of 1009
issues loaded after 2.007sec. (800 - 850)
loaded 800 issues of 1009
issues loaded after 2.002sec. (850 - 900)
loaded 850 issues of 1009
issues loaded after 2.151sec. (750 - 800)
loaded 900 issues of 1009
issues loaded after 0.467sec. (1000 - 1009)
loaded 909 issues of 1009
issues loaded after 2.167sec. (950 - 1000)
loaded 959 issues of 1009
issues loaded after 2.278sec. (900 - 950)
loaded 1009 issues of 1009
saveCurrentSelection ...
finished loading 1009 issues after 9.018sec.
post-processing finished after 0.099sec.
finished after 9.242sec.
successfully updated current selection
calculate utilizations after 0.039sec.
determine critical path after 0sec.