Debugging to get more info (server-side)
JIRA Server-side: if you want to get more information to be displayed on the console, you are running JIRA or into JIRA's logfile, you have to enable debug-mode for the Gantt-Chart addon.
Step-by-step guide
- Login as system administrator.
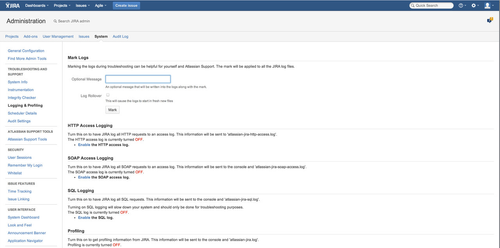
- Switch into admin mode of JIRA and select menu item "System".
- Select item "Logging & Profiling" within section "TROUBLESHOOTING AND SUPPORT"
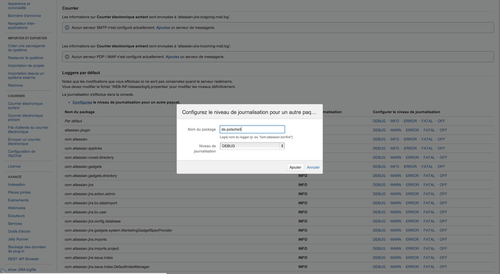
- Scroll down to section "Default Loggers".
- Click on "Configure" logging level for another package.
- Enter "de.polscheit" as package name.
- Select "DEBUG" as logging level, which is the default value.
- Click on the "Add" button.
- Now, reproduce your problem by repeating the related actions like view issue, do settings etc.
- Afterward, please send your JIRA log file for further analysis together with your incident description via email at support@traffic-light.polscheit.de.
Generally, the Jira log file is located in the filesystem: <jiraHome>/log/atlassian-jira.log.
Related articles
, multiple selections available,