Gantt-Chart for JIRA Release 4.0.x
- Frank Polscheit (PSIT)
Upgrade notes
A new custom field named "Gantt Chart" will be created globally. Afterwards an automatic upgrade task will run to modify all your issues by setting value "show" into that new custom field "Gantt Chart". It's progress is displayed in steps of 10 issues within your JIRA log file. That's a necessary pre-requisite to display Gant-Chart as column on an issue page or search result page/navigator page etc. Without any value, a custom field will never be displayed, which is one of JIRA's native features. Finally, please add that new custom field to any screen you want to show.
Improved timeline (scroll horizontally, jump to today, zoom in/out via double-click on blue timeline or switch to another period of timeframe)
If you just want to scroll horizontally, please drag'n drop the blue scroll bar left or right:

If you click on "Today" below the timeline, the Gantt Chart auto-scrolls horizontally ensuring that today is displayed on the left side of the Gantt Chart if not already visible on screen.
Use drag'n drop of the blue section of the slider to manually scroll horizontally.

If you double-click on the blue scroll bar, you toggle between the current view and the best fit view representing a total overview over the full timeframe (zoom in/out):
trying to display the full duration between min. planned start date and max. planned end date of all issues on screen by automatically switching from hourly or daily to weekly, monthly, quarterly, yearly.

If you want to change the current view to weekly, quarterly or yearly, just drag'n and drop the end handle of the slider and move it to the right: the current view will be displayed in uppercase white letters within the blue section of the timeline as well as the related number of days fitting into the displayed width of the Gantt Chart (see screenshot below: 29 calendar days can be displayed on screen within daily view).

Continue moving the end handle of the slider to the right, the duration between 23/Sep/2016 and 3/Jul/2016 is larger than 29 days. Immediately, it switches to the next timeline resolution (here: daily → weekly). Displaying weeks, 89 calendar days can be displayed on screen within the sample below. The duration between both slider handles is less: therefore the blue section illustrates that you will display all days from 3/Jul/2016 until max. planned end date (max. planned end date minus 89 calendar days) on screen.

Improved rendering of dependencies within new Gantt views
In order to distinguish between line crossings and graphical turns, rounded edges are displayed by the improved rendering.
Moving the mouse over a dependency line, it will be highlighted in yellow like using a text marker to show its flow. Additionally, a tooltip will present the source and target issue, which is helpful if not both issues are visible on the screen. Using the STRUCTURE add-on of ALM-works, you can have multiple instances of the same issues on a structure and therefore on a Gantt-Chart, too. The tooltip will reflect this by adding a sequence number in brackets after the related issue key like "DEMO-7(2) → DEMO-6" (see screenshot below: "Integration within STRUCTURE").
Improved creation of issue dependencies within new Gantt views
Open the Gantt menu on the top right of the Gantt Chart (cog icon) and click on "Edit": it will become checked and the cog icon will change to a pencil icon illustrating edit-mode.
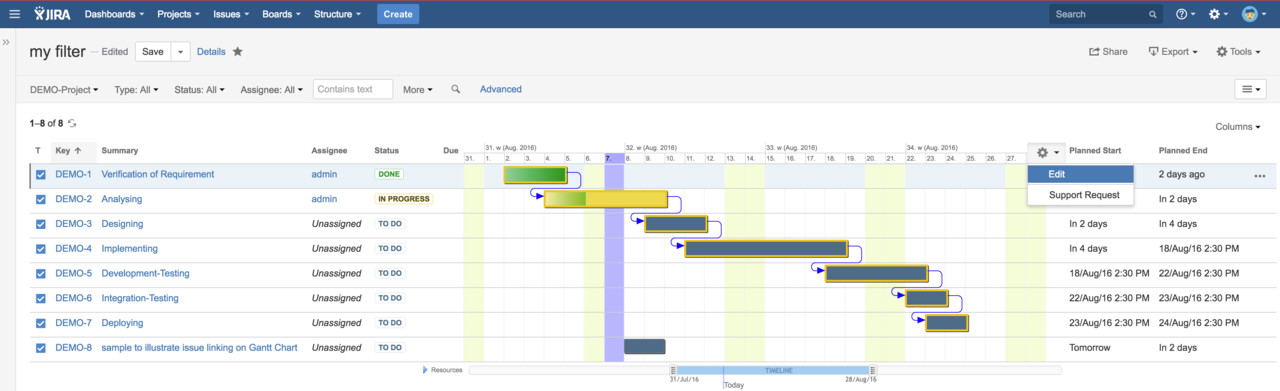
Move the mouse over the source Gantt bar, bubbles on the left and right hand side of the bar will be displayed:
Click on one of that bubbles of your source issue, depending on the type of dependency you want to create:
| dependency type | source issue's bubble | target issue's bible | |
|---|---|---|---|
| start | start | left bubble | left bubble |
| start | finish | left bubble | right bubble |
| finish | start | right bubble | left bubble |
| finish | finish | right bubble | right bubble |
Now, move the mouse over the target Gantt bar: bubbles on the left and right hand side of the bar will also occur. Then move the mouse over the related bubble according to the dependency type you want to create. The dependency between both issues will be displayed as soon as you move the mouse over one of the target bubbles, which becomes light-blue. Finally, click on that bubble to create the dependency.
If you have enabled re-scheduling, the target issue will be shifted in time depending on the dependency type. Otherwise, it's planning dates will be kept, but the the linked line between both will become dashed-red in case of violation of dependency.
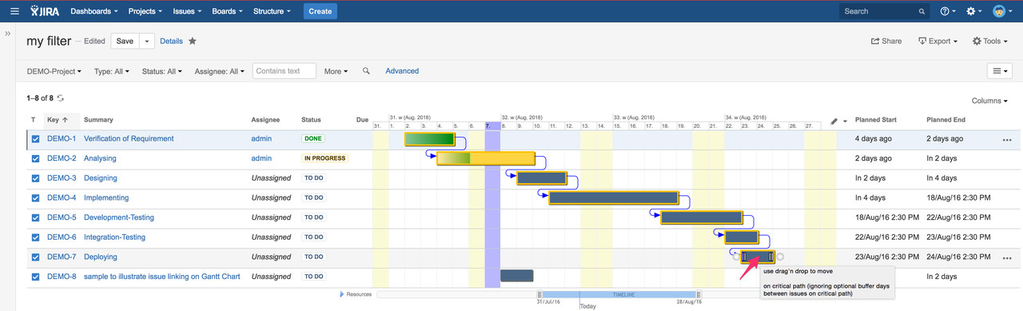
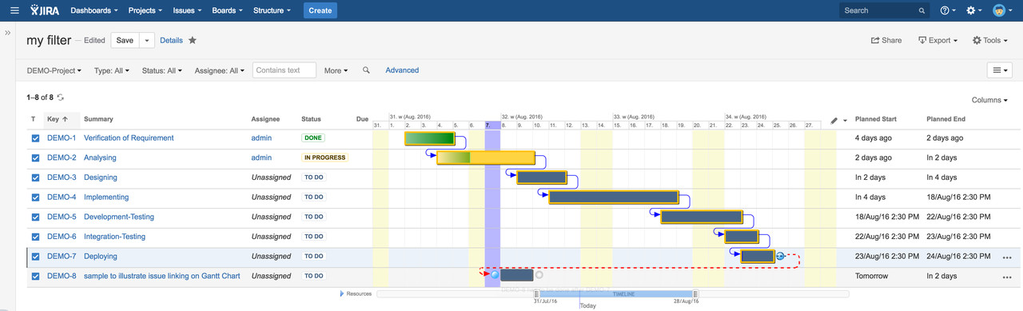
Depending on the time resolution (hourly, daily, weekly, monthly, quarterly or yearly), it may occur that the width of a gantt bar is too narrow to properly display both handles for resizing/adjusting the planned start and end dates: in that case, the right handle is displayed with a suitable distance of 20pixel to still allow drag'n drop of the bar in between to move the bar horizontally in time.
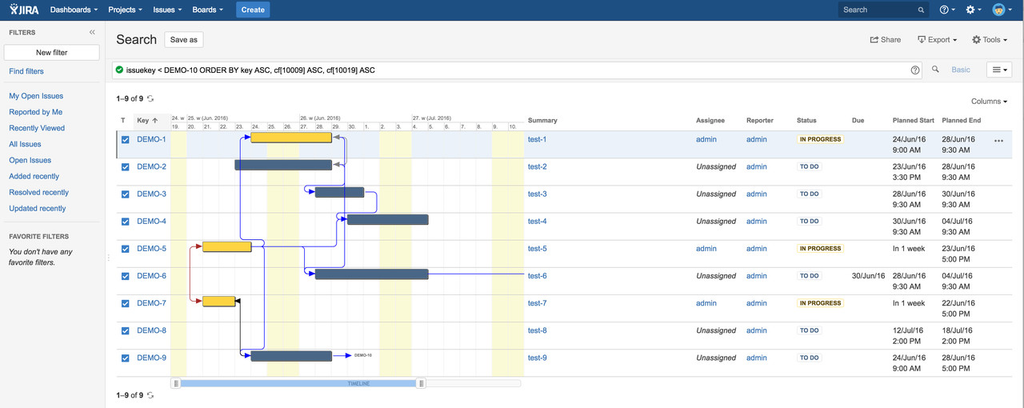
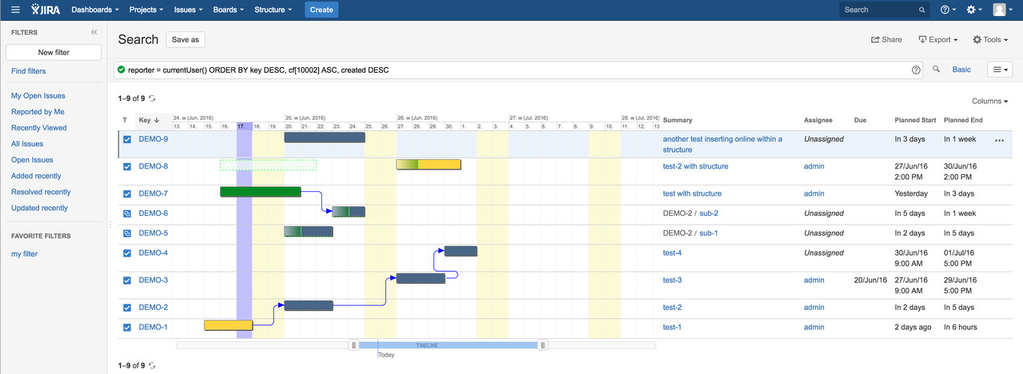
Integration into JIRA's native issue search via new column "Gantt-Chart"
Searching for issues and displaying the information/fields you need is very powerful and flexible within JIRA. Since v4.0, you can also display an integrated Gantt chart: just click on JIRA's "Columns" menu on the right and add the new field "Gantt Chart".
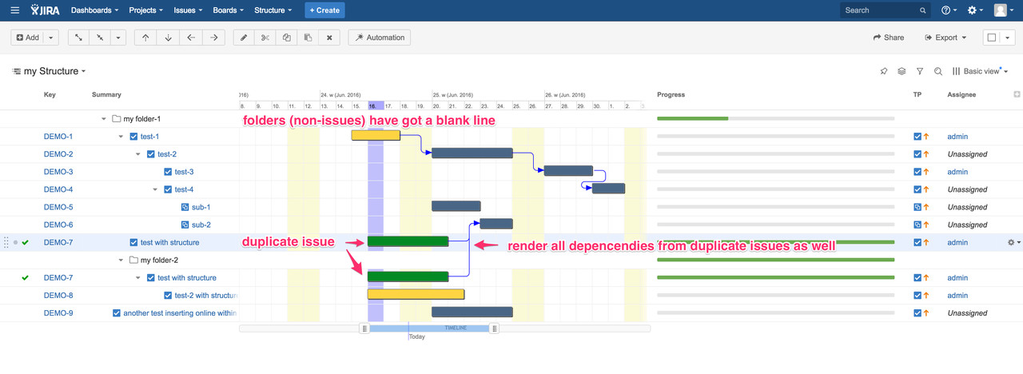
Integration into STRUCTURE v3.x(third-party add-on by ALM-works) supporting multiple instances of same issues, folders etc.
Like on issue search result screens, you can now also add column "Gantt Chart" to your structure in order to display an integrated chart, which makes it even better to use Structure together with my Gantt Chart add-on:
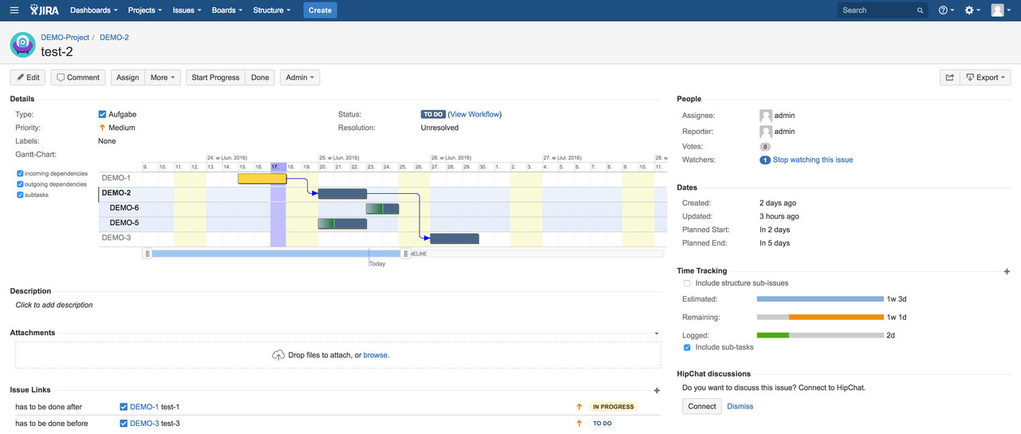
Integration into JIRA's issue page by showing an excerpt: current issue, its subtasks as well as dependent issues (incoming and outgoing)
If you add the field "Gantt Chart" to your issue view/edit screen, the current issue, it's subtasks as well as direct incoming and outgoing dependencies are displayed as focussed Gantt extract. Clicking on the checkboxes on the left, you can disable/enable incoming/outgoing dependencies and native JIRA subtasks.
Issue hierarchies of Structures are currently not supported within v4.0, yet.
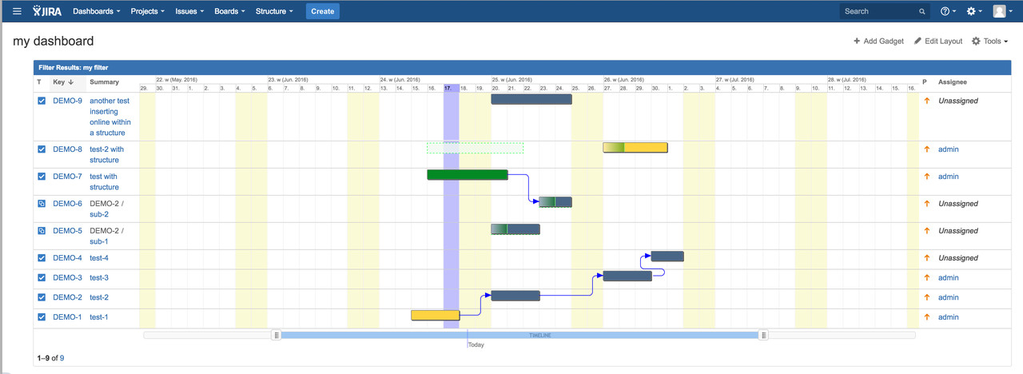
Integration into JIRA's dashboard as new Gantt-Chart column on a 'Filter Result'-Gadget for more flexibility
As already documented above, you can display an integrated Gantt Chart within JIRA's search issue result: save that as named filter, share it to your mates and also use this filter by JIRA's gadget "filter result" on your dashboard to get an overview of project timing and progress.
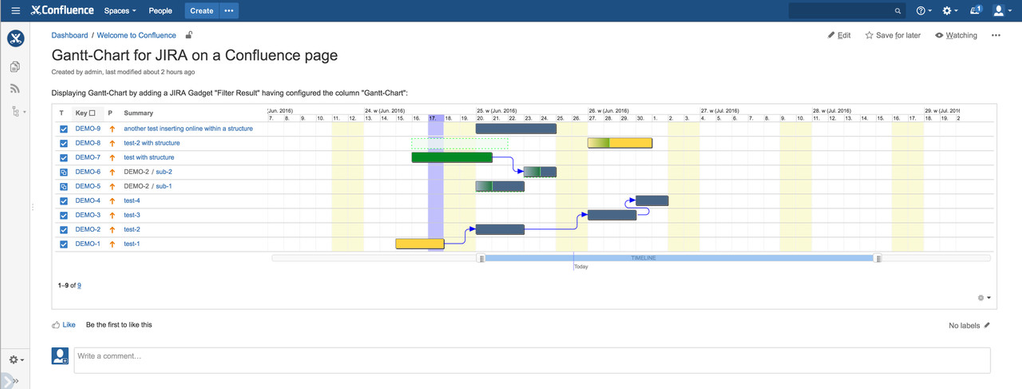
Integration into a Confluence page via JIRA "Filter Result"-Gadget having configured a Gantt-Chart column
Create a suitable JIRA filter, you can display that issues including an integrated Gantt Chart within Confluence without any cross-domain security access problems anymore(1):
- establish application links between your JIRA and Confluence servers
- check that your JIRA gadgets are also available within your Confluence (administration - External Gadgets - tab "gadget feeds" - section "Added Gadget Feeds" should display your JIRA, if not: just add your JIRA's url and click on "Add")
- edit your Confluence page
- add new macro
- select "external content"
- choose "filter result" gadget of JIRA
- specify the gadget's width
- enter the author (user), recommendation: admin
- wait until the configuration menu of JIRA's gadget is displayed within the preview
- select your saved filter
- ensure, that "Gantt Chart" is one of the listed columns, if not: select and add column "Gantt Chart"
- hit "apply" to save the gadget configuration
- hit "add" to put that JIRA gadget as Confluence macro on your page
(1) If you want to use the native "Gantt-Gadget", you cannot put that JIRA gadget on your Confluence if both are not compliant to the cross-domain-policy. That means, your JIRA server and your Confluence server must have identical internet protocol, domain and port but different paths, like "https://my.company.com:8080/jira-name" and "https://my.company.com:8080/confluence-name". Usually, you would set up an Apache http-server in front of the Tomcats for JIRA and Confluence. Unfortunately, within a lot of comanies JIRA and Confluence are configured using different protocols (one "http" and the other "https") or different ports etc. so that the cross-domain-policy prevents browsers from loading content based on security breaches. As alternative, an Apache CORS can be set up to fullfill the security policy, but most administrators have no experience in that. A deeper introduction into the web security topics is off-topic for Gantt-Chart documentation and part of general administration qualifications.
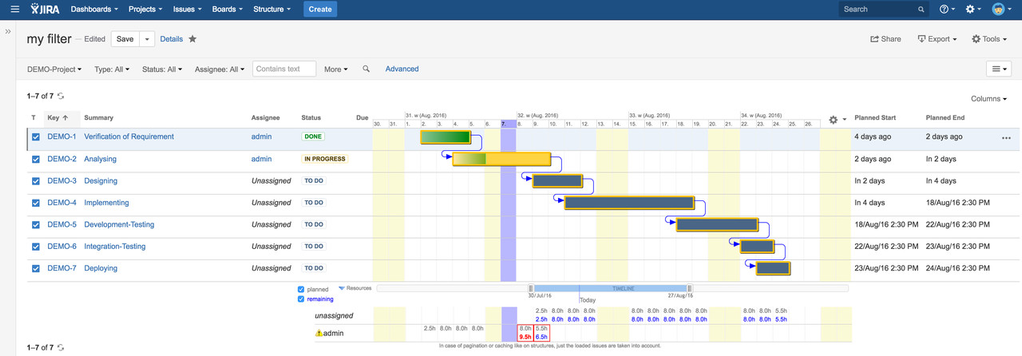
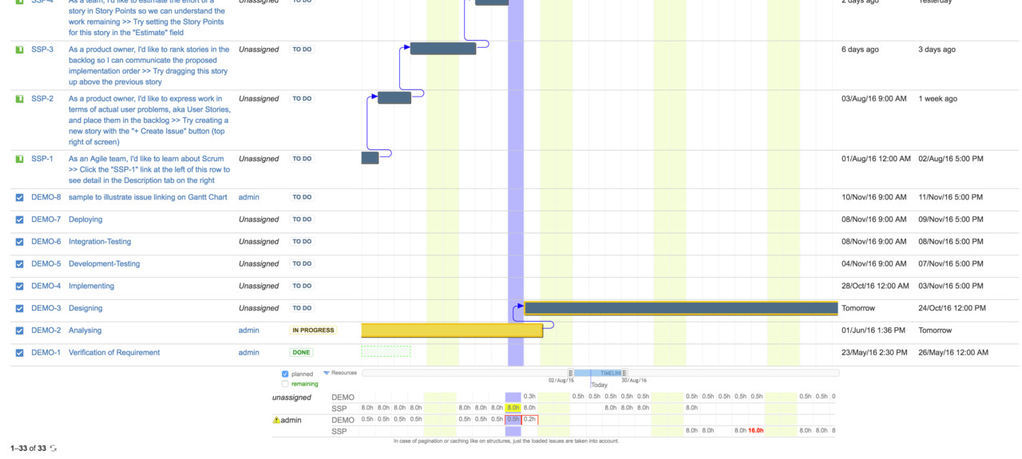
Improved Resources Overview and Utilizations grouped by assignee and (multi-)project
Click on "Resources", displayed below the Gantt Chart, to toggle resources view (expanding/collapsing). By default, the planned effort is displayed. If you click on checkbox "remaining", another line will be displayed containing the remaining efforts. A yellow warning sign in front of user's name illustrate, that on some days, the remaining effort exceeds the planned effort: that day's borders are colored in red (see screenshot below).
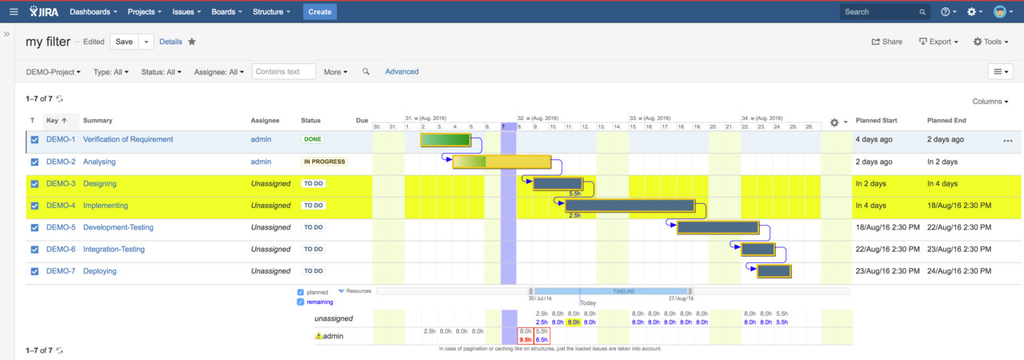
If you move the mouse over an aggregated hourly utilization of a single day on the resources section, this figure becomes a yellow background and all related issues are also highlighted in yellow. Additionally, their individual daily effort is displayed, so that the aggregation will become transparent (see screenshot below: "8.0h" of 11. Aug. 2016 within the resource section is the sum of "5.5h" of DEMO-3 and "2.5h" of DEMO-4 both being assigned to "unassigned").
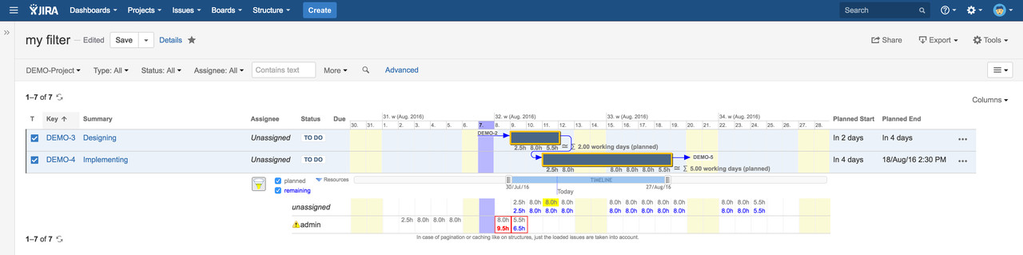
If you click on that figure (yellow "8.0h" within the resource section), all issues except the related ones will be faded out to focus on the related issues, only. Additionally, all their daily efforts will be displayed per working days as well as their total effort as sum per issue (see screenshot below). A "filter icon" is also displayed on the left hand of the checkboxes for "planned" and "remaining" to illustrate that reduction of issues: click on that icon or on the same figure of the resource section to revert to the original issues' view.
If you have selected issues of multiple projects, the resource overview will group by assignee and project like you can see on the following sample screenshot:
Resources for "unassigned | DEMO" and "unassigned | SSP" as well as "admin | DEMO" and "admin | SSP".
Calculation of utilizations:
Within the add-on's main configuration, you can specify general daily time of start-working and end-working. Each planned start time and planned end time is rounded to half hour in order to fit hourly-view displaying half hours per day between start- and end-working time. If a start time is set before the configured time of start-working, the later will be used. Equivalent for the end time and end-working time. If the duration in working time between planned start and planned end is equal to the issue's original estimated effort, the first and last day's utilization will be calculated based on rounded start/end time. All working days in between have got the configured amount of working hours. If the working duration is less or greater than the original estimated effort, than the effort will be linearly distributed per daily duration of each working day, so that part-time working will be illustrated correctly.
Remaining utilizations are calculated analog but just into the future from current today. Therefore, take care to configure your JIRA workflows to set remaining effort to zero if an issue is resolved, done and/or rejected etc.. Otherwise the remaining hours will be displayed on current today although the related state is resolved / done!
Please pay attention: in case of issue pagination on search result page(s) or issue caching as used within Structures by ALMworks, just the loaded issues are taken into account as the calculations will be done on client-side during run-time. On the new Gantt Panel, all loaded issues are taken into account.