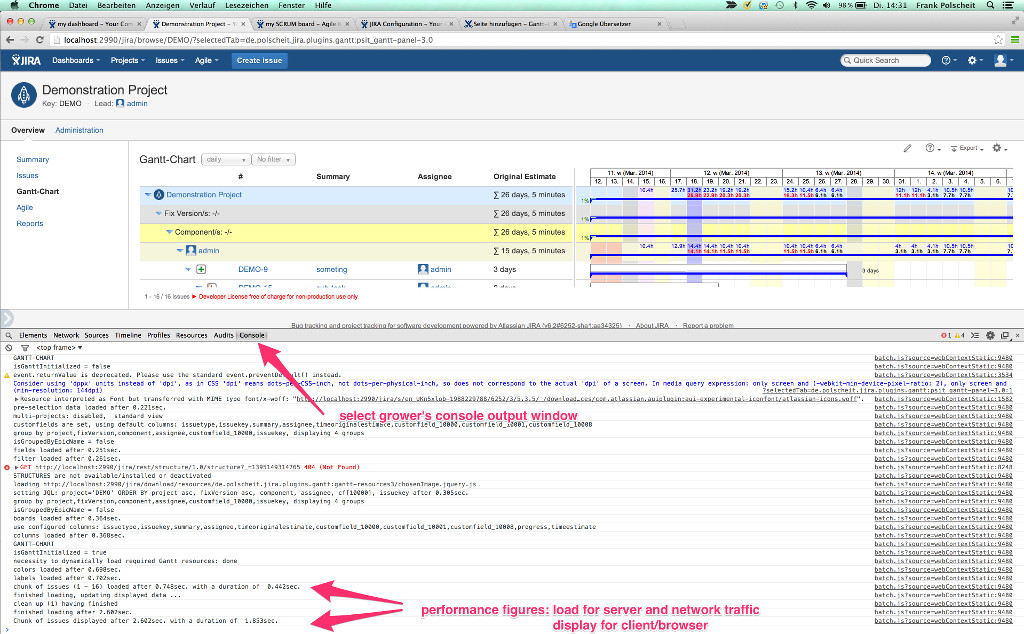
Within your browser, you can see end-to-end as well as loading performance figures. Please proceed as documented below, depending on the browser you are using.
Within an optimized JIRA infrastructure, you can load 1.000 issues within less than 3 seconds. Load times depend on the performance of your JIRA server as well as database server. If your JIRA delivers chunks of issues (by default 50 issues per request, the last one can be less) too slow to the browser, the Gantt-Chart addon cannot display them faster.
Open your browser's console:
Browserhow to open the console windowGoogle Chrome hit  on an Apple MAC / OSX or click on the browser's menu on the top right, select menu item "Tools" and choose sub-menu item "dev. tools"
Apple Safari hit 
Mozilla Firefox use the free add-on "FireBug" (you have to manually install this add-on into your Firefox) Microsoft IE10/11 hit keystroke "F12" - Select tab "Console", which can vary depending on your browser