Step-by-step guide
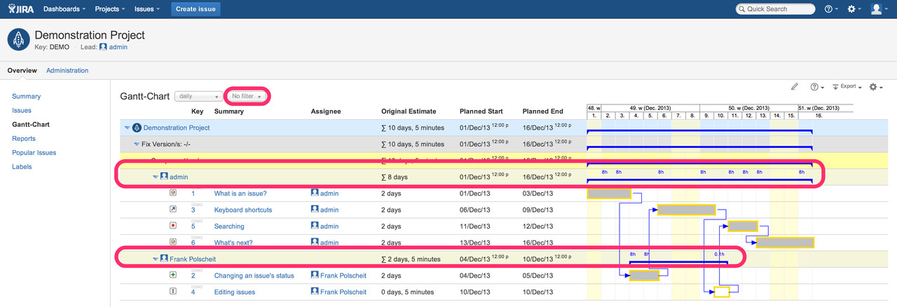
- use the default for issue selection ("No filter") or
- any favorite filter having an ORDER BY clause containing "assignee" or
- click on Gantt menu item "configure columns", enable option "Group by columns below instead of auto-grouping based on ORDER-BY-clause of related JQL. Attention: grouping is a visual feature having no influence on the issues sort order!", add column "assignee" beside all other columns you want to group by and hit finish (pre-requisite: this feature is not available for SCRUM/Kanban board selection)
In all cases above:
- if you use loading by scrolling down, the assignee's utilization will be calculated and displayed reaching another assignee or end of issue selection (otherwise, you would aggregate incomplete list of issues resulting in wrong numbers)
- if you use loading at once/initial loading, all assignee's utilization will be aggregated and displayed
- the utilization figures are rounded to one digit after the comma – if necessary – and displayed using a font size of 10px: if that's to small to be read comfortably,
move the mouse over the related figure and the number will be enlarged automatically for better readability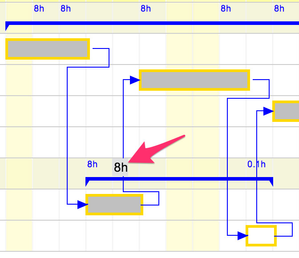
Gantt-Chart versions prior to v3.0.1 have got a separate project tab panel for displaying a view for resource planning. Since v3.0.1, this has been integrated for more flexibility.
Related articles