Debugging to get more info (client-side)
- Frank Polscheit (PSIT)
Owned by Frank Polscheit (PSIT)
Last updated: Sept 09, 2020
Client-side: if you want to get more detailed information concerning e.g. JavaScript Errors or Performance figures, please read the console output within your browser.
Step-by-step guide
Open your browser's console:
Browser how to open the console window Google Chrome hit
 on an Apple MAC / OSX or click on the browser's menu on the top right, select menu item "Tools" and choose sub-menu item "dev. tools"
or CTRL-Shift-I on Microsoft Windows. Alternatively, you can click on function key "F12".Apple Safari hit
Mozilla Firefox hit on an Apple MAC / OSX
or CTRL-Shift-I on Microsoft Windows
or use the free add-on "FireBug" (you have to manually install this add-on into your Firefox)Microsoft IE10/11 hit keystroke "F12" - Select tab "Console", which can vary depending on your browser
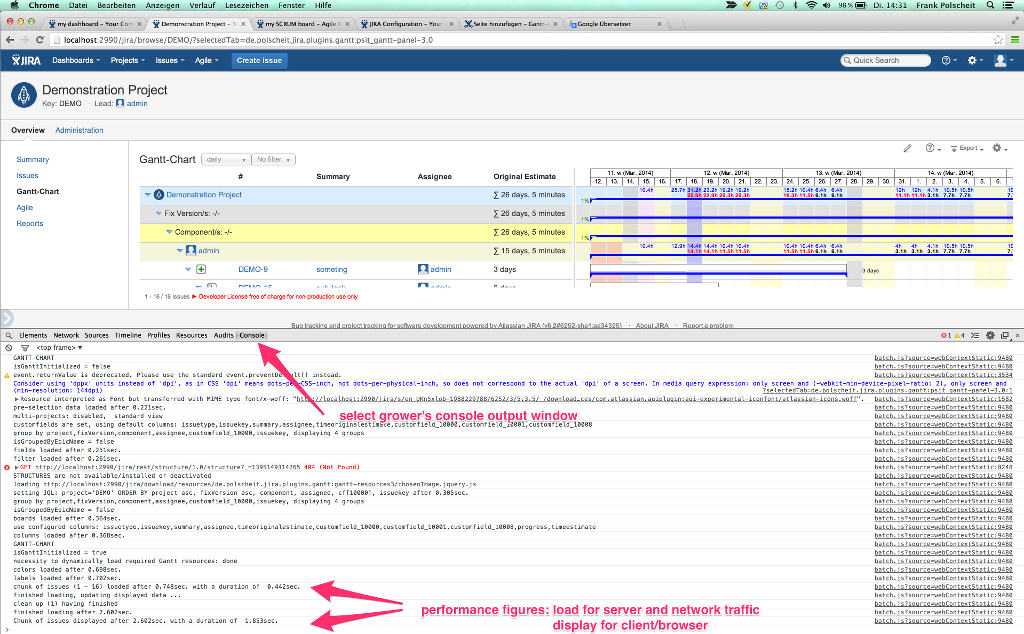
In case of any JavaScript-Error, you will get an error message, which is collapsed by default: please click on the expand arrow.
Instead of make a screenshot, which may display just a part of the output, click into the console output area with your mouse, then hit CTRL-A to mark
all console output, followed by CTRL-C to copy that into your clipboard and use CTRL-V to paste it into the related support ticket/issue or send it to me
via email at frank@polscheit.de for further analysis.
Video on how to get necessary info
=> Please click on the link and watch my video: Gantt-video-instruction.mp4
Related articles
, multiple selections available, Use left or right arrow keys to navigate selected items