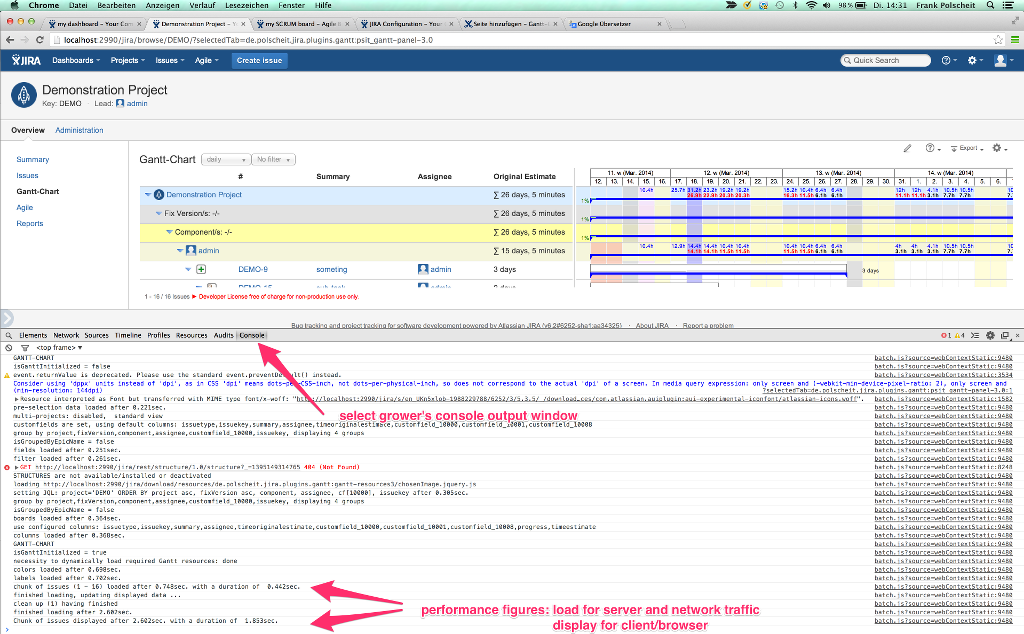
Client-side: if you want to get more detailed information concerning e.g. JavaScript Errors or Performance figures, please read the console output within your browser.
Step-by-step guide
Open your browser's console:
Browser how to open the console window Google Chrome hit  on an Apple MAC / OSX or click on the browser's menu on the top right, select menu item "Tools" and choose sub-menu item "dev. tools"
Apple Safari hit 
Mozilla Firefox use the free add-on "FireBug" (you have to manually install this add-on into your Firefox) Microsoft IE10/11 hit keystroke "F12" - Select tab "Console", which can vary depending on your browser
In case of any JavaScript-Error, you will get an error message, which is collapsed by default: please click on the expand arrow and copy & paste this information into an email at gantt@polscheit.de
Alternatively, you may get the following stack trace to be copied into an email as above: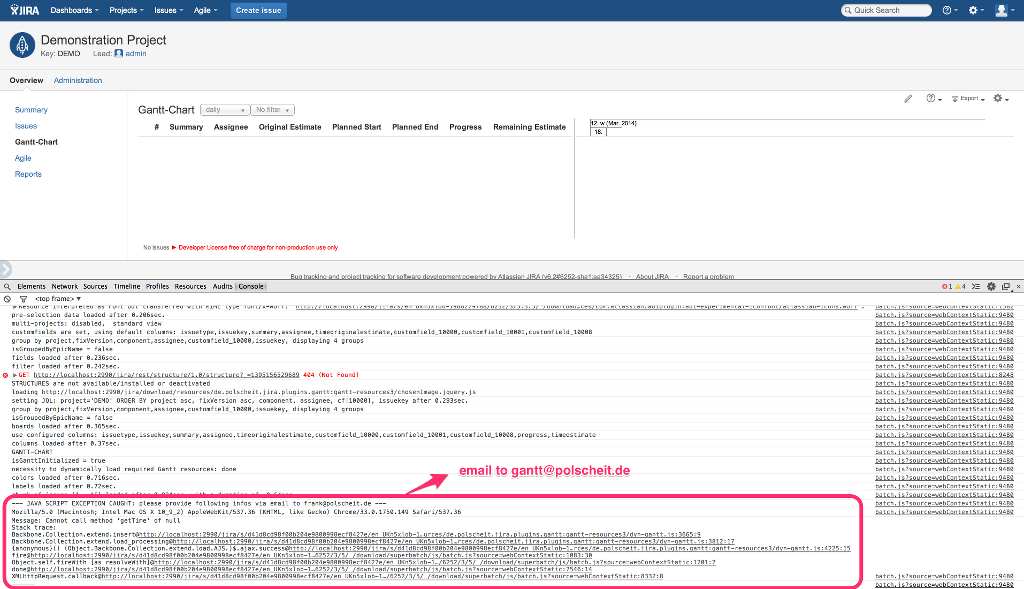
3. Select tab "Network", which can vary depending on your browser and have a look for AJAX-calls not resulting in HTTP-200 and provide that information, too.
Related articles