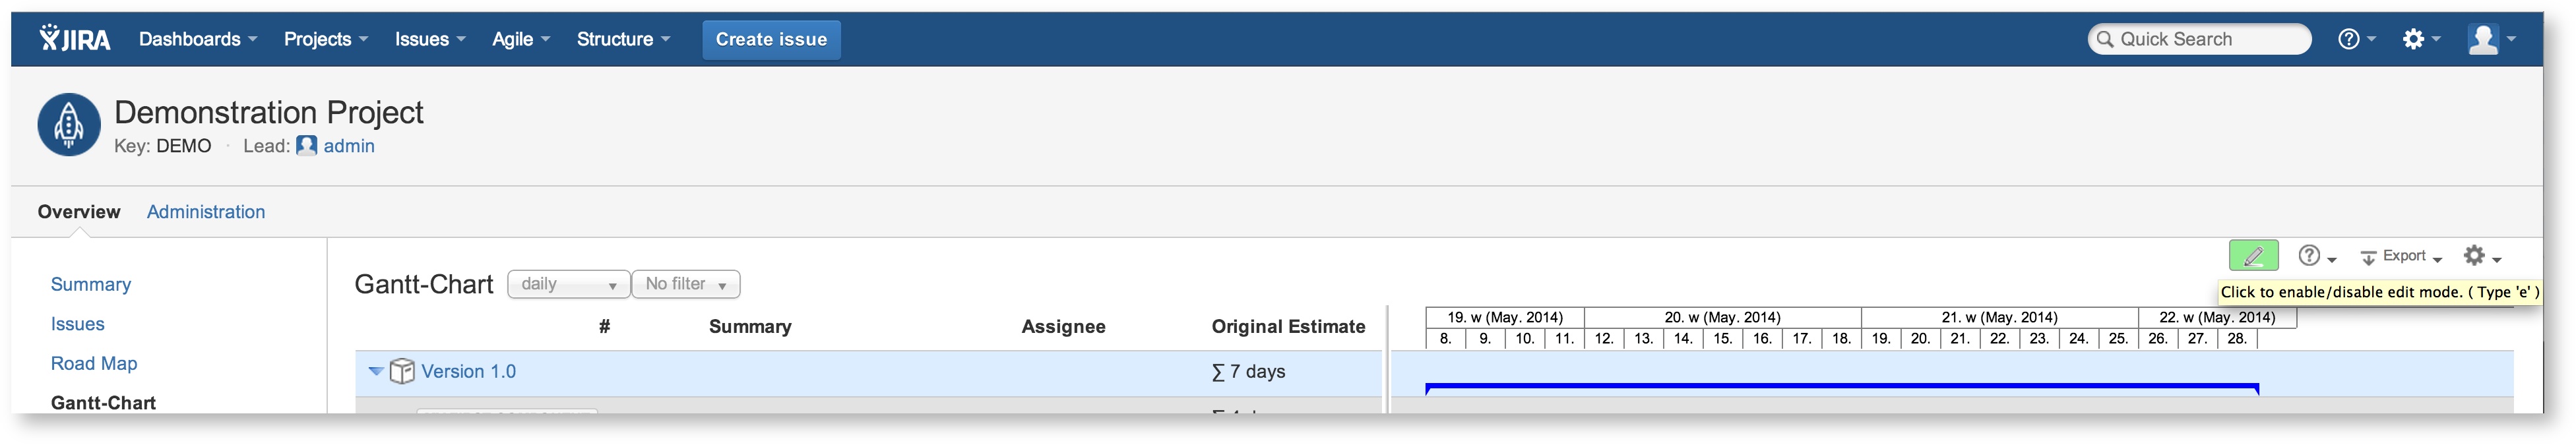
Interactive editing of cell content on the left side of the Gantt-Chart as well as moving, resizing or linking issues within the Gantt diagram on the right can be done when edit mode has been enabled. Clicking on the pencil icon on the top right toggles the edit mode. If edit mode has been enabled, the background color of the pencil is displayed in green as shown below.
Edit-issue permission
If the logged in user has edit permissions for the current project, the pencil will be displayed on the right top of the Gantt-Chart and it is possible to modify almost each field content displayed on the left side. The columns, which are displayed on the left can be configured individually via menu item "configure columns".
Schedule-issue permission
If the logged in user has scheduling permissions for the current project, the pencil will be displayed on the right top of the Gantt-Chart and it is possible to modify due dates if they are displayed on the left side. This can be configured individually via menu item "configure columns". Within the Gantt diagram, issues can be moved and resized using the mouse and drag'n drop. Additionally, issues can be linked using Gantt-dependencies like finish-start, start-start, finish-finish or finish-start, which may cause an automatic re-scheduling of all dependent tasks.