Getting Support ...
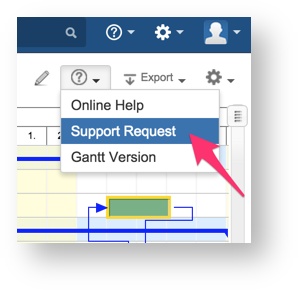
Please click on the ![]() -menu at the top right side of a Gantt diagram and select menu item "support request" in order to fill out an email with necessary information like used version etc. If you are not able to reach that menu item, please write an email at gantt@polscheit.de and paste your Gantt-Chart SEN (software entitlement no. see https://my.atlassian.com) as well as Gantt-Chart version in addition to your support request.
-menu at the top right side of a Gantt diagram and select menu item "support request" in order to fill out an email with necessary information like used version etc. If you are not able to reach that menu item, please write an email at gantt@polscheit.de and paste your Gantt-Chart SEN (software entitlement no. see https://my.atlassian.com) as well as Gantt-Chart version in addition to your support request.
Based on your email, a related JIRA issue will be created as well as an account for you if you do not already have one within my system.
Content
Gant-Chart Overview
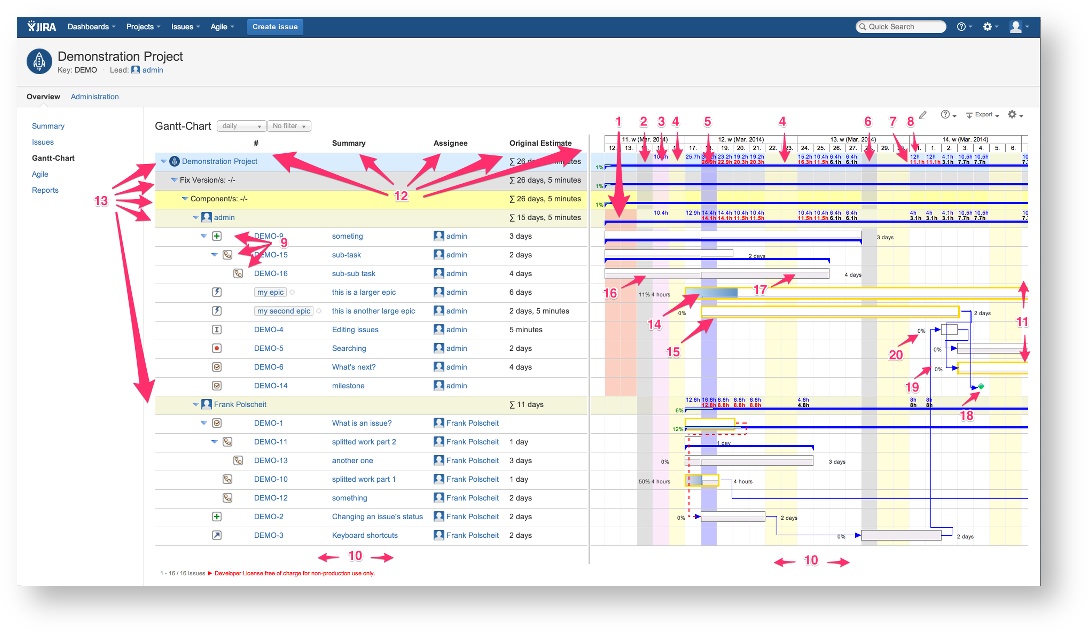
- Assignee's unavailable days, like non-working day as holidays or planned time not to work for this project doing something else, are marked by a light red background color.
- Project's non-working day(s) are colored using a light gray background.
- Project's special working day(s) on general non-working days, like planned work on weekends, are colored using a light blue background.
- Weekends are colored with a light yellow background.
- Today is colored with a blue background column.
- Global non-working day(s) are colored using a light gray background, wich is a bit darker than the project's non-working days.
- Aggregated future average utilization including today are displayed as small figures within the second line. If you move the mouse over such figure, it will be enlarged for better readability. That number is an aggregation per selected time period (daily, weekly, monthly etc.) resp. sum of all issues' values fitting into that time period. Each issue's value will be calculated as an average future utilization: remaining estimated effort / remaining working days. This figures will be displayed if the ORDER BY clause of the related JIRA filter contains "assignee". Within the project row and all assignee grouping rows, they are displayed. Collapsing the assignee rows, you'll get a fast overview of your teams future utilizations. This utilizations can exceed the configured amount of working hours of JIRA: in this case, the related figures are displayed in red to indicate over-allocations. As project manager, you have various options to handle this: you can shift planned end date of related issue(s) into the future to get more working days in order to do the work if your customer accepts that, you can work on non-working days like weekends to reach the original plan, you can agree with all involved parties over-working (in some countries, you would have to check this by labor unions) or you can split such an issue into multiple sub-issues being assigned to various team members to be done in parallel if possible. I have not implemented any automation for such scenario as this is one of the main tasks of a project manager to escalate and decide proper actions.
- Aggregated planned average utilization as small figures within the first line. In opposite to the future utilization, the issue's value is an average of the planned utilization: original estimated effort / number of working days between planned start and end date of an issue.
- Multi-level hierarchies (Work-break-down structures/WBS) are possible.
- You can scroll horizontally within the left info panel as well as within the Gantt diagram on the right.
- You can scroll vertically within the Gantt diagram on the right and the left info panel will be aligned automatically.
- The columns of the left info panel can be configured per individual user and selected JIRA filter/agile board/structure. This is more flexible than JIRA per-user settings as a user may have several roles and a different need for information based on that. Within the Gantt menu, select item "Configure Columns" to add/remove/sort the columns.
- Grouping rows are automatically determined out of the ORDER BY clause of the selected JQL (JIRA filter/agil board/structure) to get the most flexibility.
- An issue's progress will be displayed by a bar growing from left to right (=100%) inside the Gantt bar. The color can be configured per user and selection, too: within the Gantt menu, select item "Look & feel Configuration" and tab "Gantt Features".
- If an issue is on the critical path, it will be colored by default having a bold orange border. The look & feel can be configured per user and selection, too: within the Gantt menu, select item "Look & feel Configuration" and tab "Gantt Features".
- Issue's planned average utilization is displayed like its progress but from bottom to top in light gray. The "Aggregated planned average utilization" (see above) is a sum of that per time period.
- Issues's future average utilization is displayed like its planned average utilization as a gray box, too. If less work has been done and logged for the past, more work has to be done within the future including today to reach the planned end date. In that case, this box will be higher than the issue's planned average utilization in the past.
- Milestones are display by a diamond. It is colored in green or becomes red, if its planned end date exceeds its due date. That can happen by a re-scheduling automatically triggered by shifting the planned end date of an issue, the milestone depends on.
- Gantt dependencies (finish-start, start-finish, start-start and finish-finish) are displayed as arrows between the related issues using the configured color. If an issue depends on another issue, which is not selected and therefore not displayed, that dependency will be shown as a reference to that other issue to keep this information.
Gantt bars can have labels on the left and/or on the right side. Almost every available system and custom field can be configured to be displayed here. Some like to see as much information as possible, other users have an opposite requirement. In order to suit all users, this can be configured per user and selection. By having this feature available, a user can create different filters and related look & feel dependent on the project role and need of information.