JIRA Server-side: if you want to get more information to be displayed on the console, you are running JIRA or into JIRA's logfile, you have to enable debug-mode for the Gantt-Chart addon.
Step-by-step guide
- Login as system administrator.
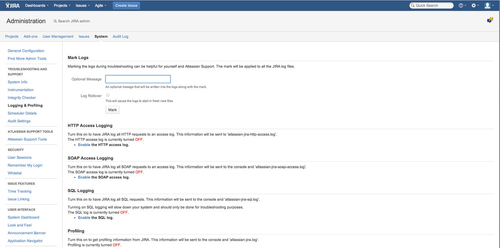
- Switch into admin mode of JIRA and select menu item "System".
- Select item "Logging & Profiling" within section "TROUBLESHOOTING AND SUPPORT"
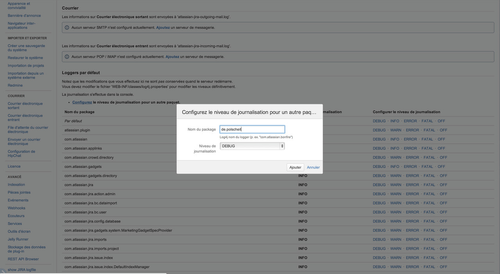
- Scroll down to section "Default Loggers".
- Click on "Configure" logging level for another package.
- Enter "de.polscheit" as package name.
- Select "DEBUG" as logging level, which is the default value.
- Click on the "Add" button.
- If you do not know the directory of JIRA's log file within the file system of your server, please use my additional menu item "show JIRA logfile" to load the log file's content into the browser.
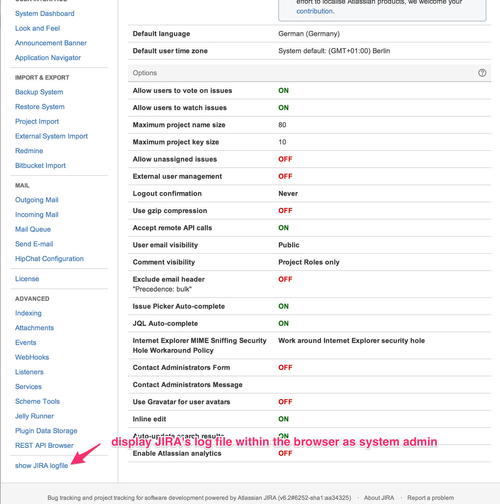
Click on "show JIRA logfile" or use the URL displayed within the following screenshot on top (replace "localhost:2990/jira" by JIRA's baseurl according to your local configuration) to get your JIRA logfile straight ahead into your browser without the necessity to access your server via terminal window or ftp. Beware, that the logfile may contain a lot of data and that scrolling takes some time. In such cases, I recommend to store the content into a local file and open that within an editor application for faster search like the free "notepad++" on Windows maschines or e.g. TextMate (Apple OSX).
Please send your JIRA log file for further analysis together with your incident description via email at group-sign-off@polscheit.de or create a new JIRA issue (https://polscheit.atlassian.net/projects/GSO/summary) and attach the JIRA log file, there.
Related articles
| Filter by label (Content by label) |
|---|
| showLabels | false |
|---|
| max | 5 |
|---|
| spaces | GANTT |
|---|
| showSpace | false |
|---|
| sort | modified |
|---|
| reverse | true |
|---|
| type | page |
|---|
| cql | label = "debug" and type = "page" and space = "GSO" |
|---|
| labels | debug |
|---|
|