| Table of Contents |
|---|
Select issues and choose view
Based on the new rendering engine of Gantt-Chart version 4.x, a new Gantt panel on project level has been introduced:
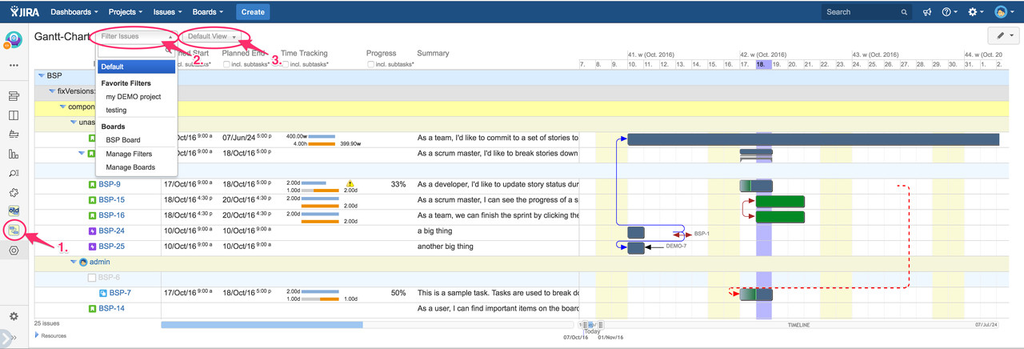
Increase of performance as well as better usability and enhanced user acceptance have been the internal guidelines for that new development. Within seconds, you will see the hierarchy of selected issues (multi-level hierarchies will be displayed if related issues are linked by "parent-child relationship" issue link type, which is created as new issue link type by the Gantt-Chart add-on). Immediately, you can scroll down to the issues you are interested in. In parallel, all necessary data are loaded from your JIRA server and database in the background. Using an average hardware equipment, that needs just about 5 - 10 additional seconds for 1000 issues. A progress bar within the timeline on the bottom right will be displayed to give interactive feedback. As soon as all necessary data are available, they will be displayed on screen.
At launch of v4.1, there will be 5 pre-defined views available: one default view, one for planning and one for controlling your project(s) as well as two agile views: "view by sprints" and "view by epics" having different grouping of issues and their children. The "view by sprints" will have got epics, sprints and backlog as top-level grouping. Issues will be displayed by their rank according to their position within the chosen agile board. Sub-issues will be displayed below their parents.
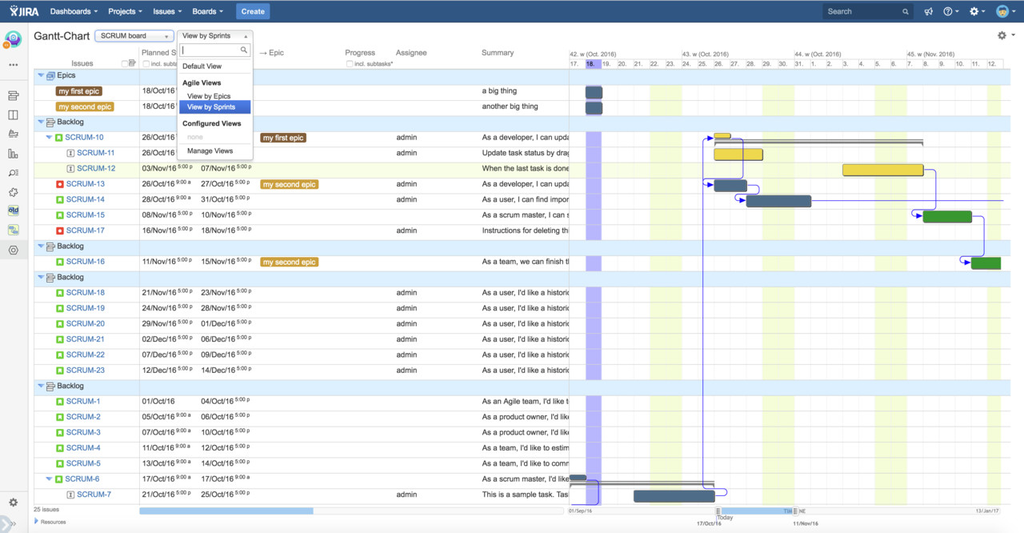
On "view by epics", the top-level represent your epics. The second grouping will represent the sprints and the third grouping will contain the assignees:

In opposite to prior Gantt-Chart versions 3.x:
- Vertical scrolling uses your browser's standard scroll bar on the right of the Gantt-Chart and you can scroll very fast over large data sets, now!
- Horizontal scrolling is available via the zoomable timeline below the Gantt diagram at the bottom and also for the section of issue data on the left.
- New feature: the issue keys and their structure will always be displayed for better usability. The current row will be highlighted in very light yellow for improved readability.
Controlling-View
Using the pre-defined "controlling view", your selected issues are grouped by project (multi-project capable if issues of selected filter/board/structure belong to different projects) and fix version/release followed by Schedule Performance Indicator (SPI) and Schedule Variance actual vs. planned (SVa) used to make an automatic assessment to indicate groups:
- "behind schedule",
- "on schedule",
- "ahead of schedule" or
- "to be done in future"
as well as additional information within the next following group:
- "more time than planned",
- "less time than planned" or
- "same time as planned"
Concrete figures of SPI and SVa are also displayed as separate columns containing the calculated values. A tooltip is available on each of this fields.
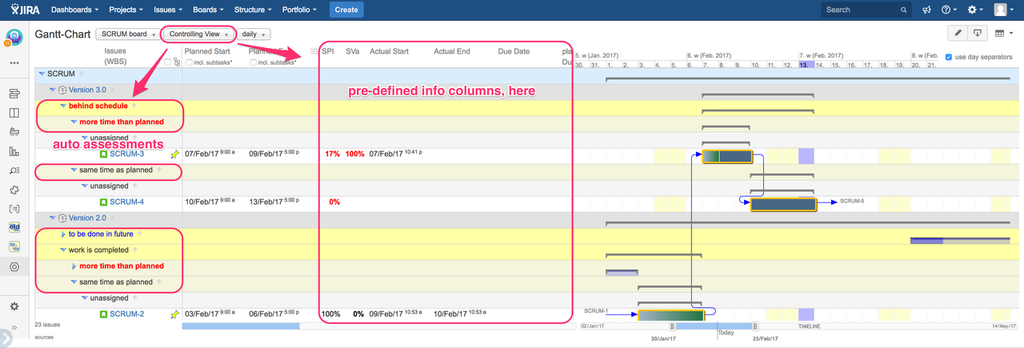
Available since v4.0.10.
Planning-View
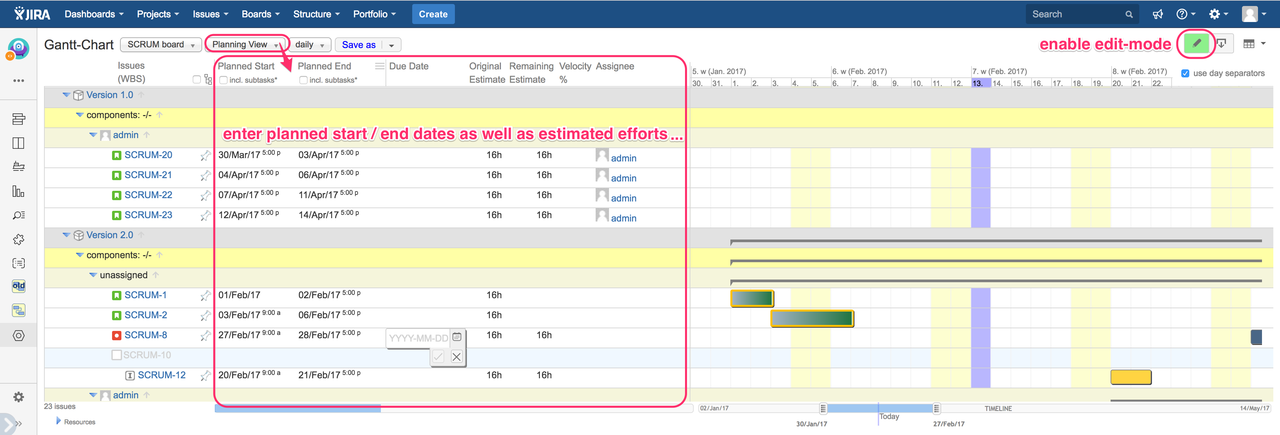
Available since v4.0.10.
Collapse/Expand groups
On the left side of each grouping row and all parent issues, an arrow icon is displayed indicating an expanded or collapsed set of issues below. Just click on that icon to toggle. Within collapsed representation on the Gantt-Chart, all related issues are displayed inline with 20% transparency in light blue as shown on the sample screenshot below. Transparency enable visualization of overlapping tasks: more overlapping issues are darker than less/single issue(s). So, beside the duration of the grouping element, the distribution in time of related issues is displayed for better controlling.
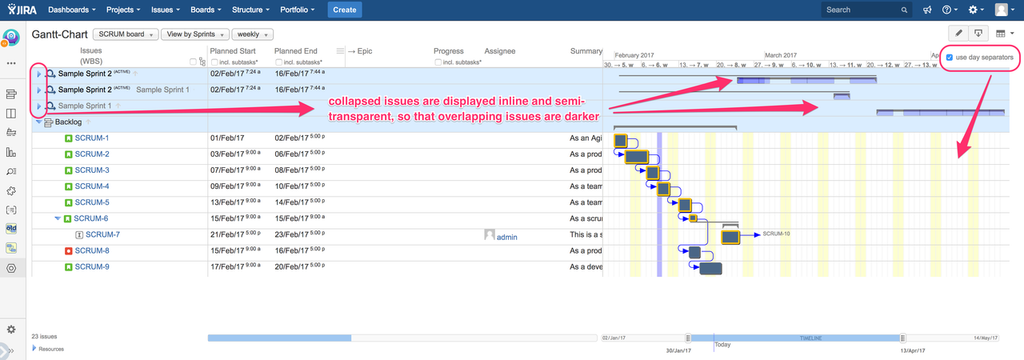
This feature is available on the new Gantt project panel since version 4.0.10.
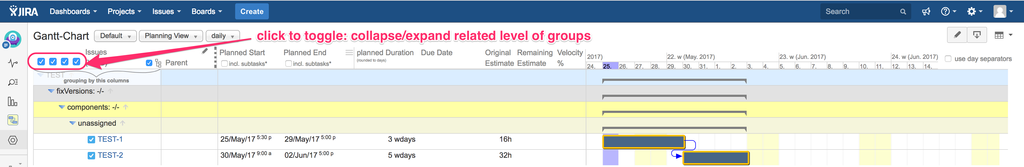
Since Gantt-Chart v4.1.6, you can use the checkboxes on top of the grouping columns to collapse or expand related level of all groups by a single click.
Sorting of issues
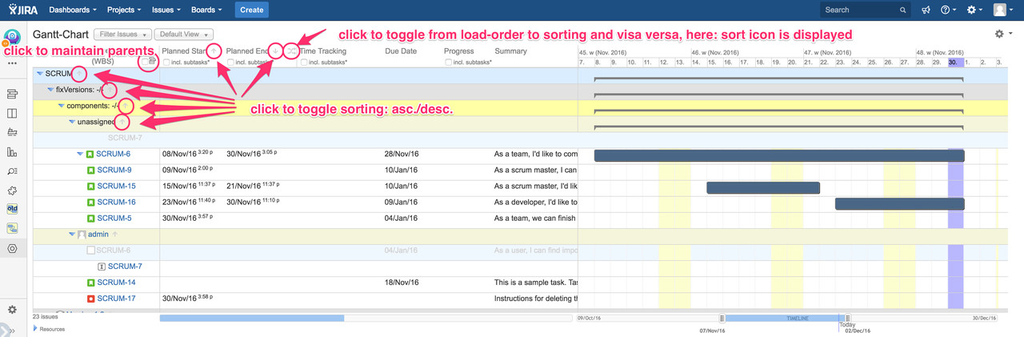
By default, all issues will be grouped ascending by their multi-level grouping hierarchy. You can modify that grouping columns as described within the related section below. Within each group, the issues will be sorted by their creation date resp. issue key containing increasing auto-numbers. If you click on icon ![]() , which is positioned on the right side of the sorting section (left to "Time Tracking" on the screenshot below), you can toggle to sort-mode being represented by icon
, which is positioned on the right side of the sorting section (left to "Time Tracking" on the screenshot below), you can toggle to sort-mode being represented by icon ![]() . In that case, all issues within a group will be sorted by the sequence of specified sorting fields, here: first by planned start (asc) and the by planned end (desc).
. In that case, all issues within a group will be sorted by the sequence of specified sorting fields, here: first by planned start (asc) and the by planned end (desc).
Maintaining work-breakdown-structures (multi-level parent-child hierarchies)
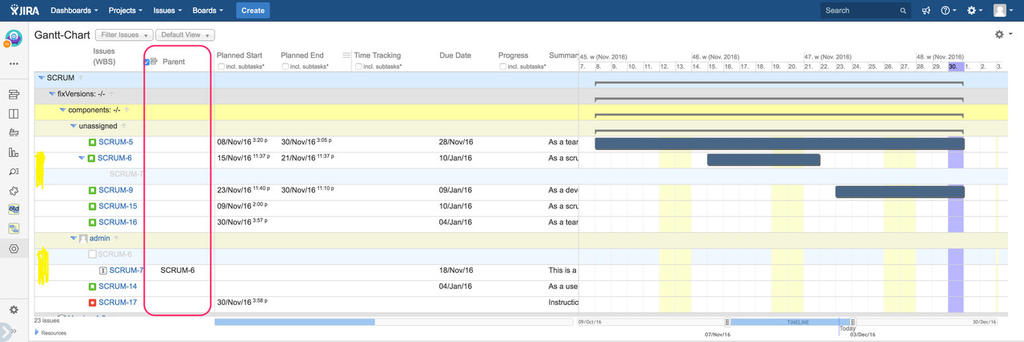
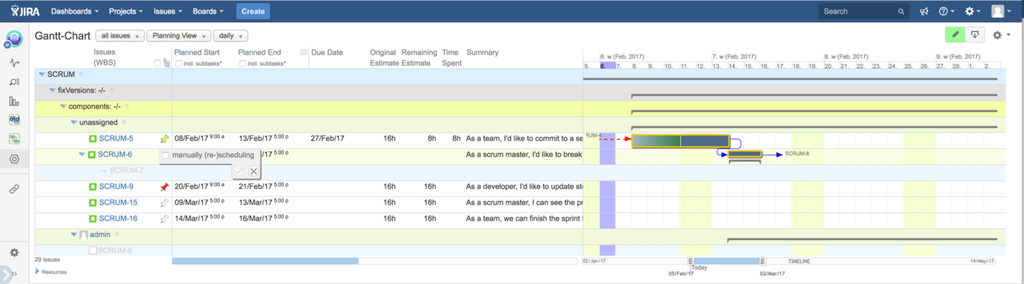
Please click on icon ![]() on the right side of column header "Issues (WBS)" to enable this option and to expand another column containing the direct parent issues. By default, that column is not displayed to save space on the window for the Gantt diagram on the most right. Have a closer look on the marked rows in yellow: SCRUM-6 is parent of SCRUM-7, but both belong to different groups (here: grouping by project, fixVersion, components and assignee) as the parent is unassigned but the child has got an assignee. That case is visually represented by so called "shadow" rows to illustrate that. You can move the mouse over such a row in light blue and stay to display a related tooltip.
on the right side of column header "Issues (WBS)" to enable this option and to expand another column containing the direct parent issues. By default, that column is not displayed to save space on the window for the Gantt diagram on the most right. Have a closer look on the marked rows in yellow: SCRUM-6 is parent of SCRUM-7, but both belong to different groups (here: grouping by project, fixVersion, components and assignee) as the parent is unassigned but the child has got an assignee. That case is visually represented by so called "shadow" rows to illustrate that. You can move the mouse over such a row in light blue and stay to display a related tooltip.
If you have enabled edit-mode by clicking on gantt menu item "edit" on the top right, move the mouse over a parent cell and you can enter or edit the parent issue of that issue. Type in the issue key or a search word, which will be auto-completed and select from the result set (see screenshot below). Using this feature, you can specify multi-level issue hierarchies (issue → issue → issue → subtask → etc.) independent from JIRA's native construct of issue-subtask (2-level hierarchy, only). To get maximum flexibility, a child issue must not be within the same project as the parent issue and the issue types do not matter at all.

| Anchor | ||||
|---|---|---|---|---|
|
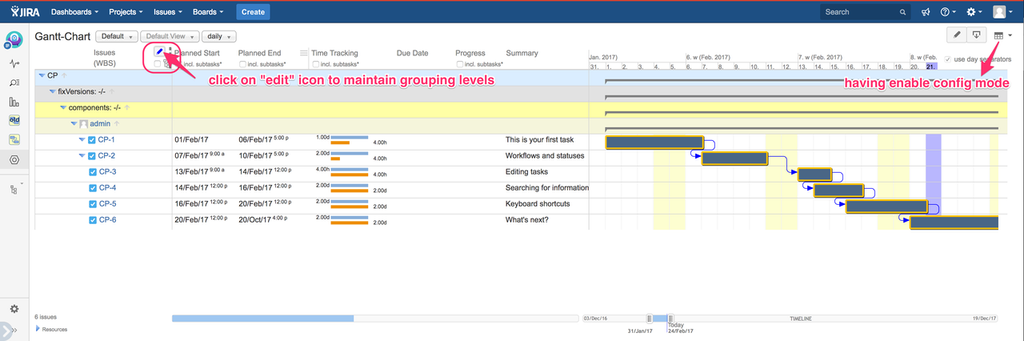
Having enabled configuration-mode on the top right, please move the mouse over the column-head of "Issues (WBS)", a new icon with a pencil will occur.
By default, that will be enabled, so that you can skip this and continue with moving the mouse over the pencil-icon (next screenshot below).
Move the mouse over the pencil-icon and click to open the popup window for configuring grouping columns as illustrated below.
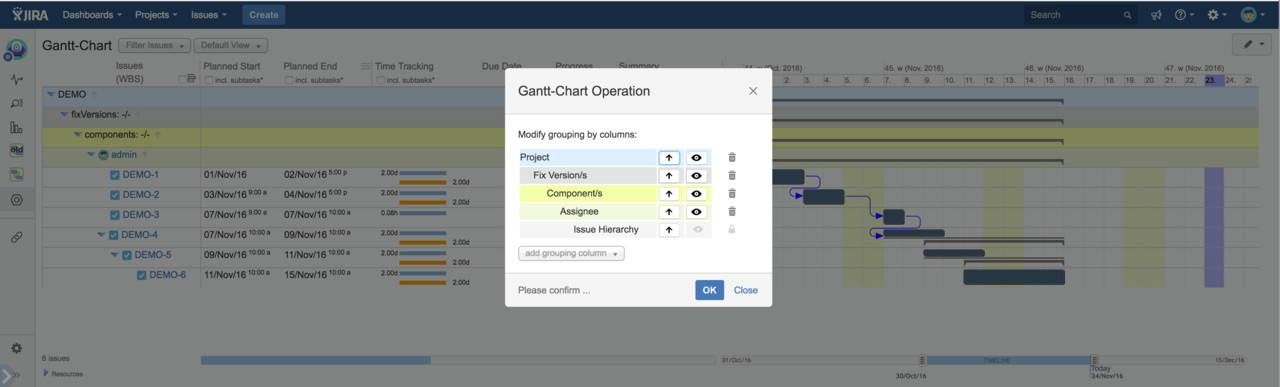
On this configuration panel, you can remove any grouping row by click on the related trash icon on the right. Additionally, you can specify the sort order (ascending or descending) and if that grouping row is visible on screen. Sometimes, you want to group by a criteria but not display the group field as own row. In such cases, please click on the related eye icon to de-select visibility. Internally, the issues still be grouped as specified.
Having modified grouping according to your needs, please save it:

As the currently display view is one of the provided/pre-defined views, you have to click on "save as" to store your settings as new user-specified view. If you have got admin privileges, you can also overwrite the "Default View" using your modified settings as shown on the sample screenshot. In that case, every user selecting "Default View" for this project will see your settings (sharing for everybody).
Modify displayed columns
As soon as you have modified columns (added or removed), a new button "save" will be displayed on the top right side of the view selection:
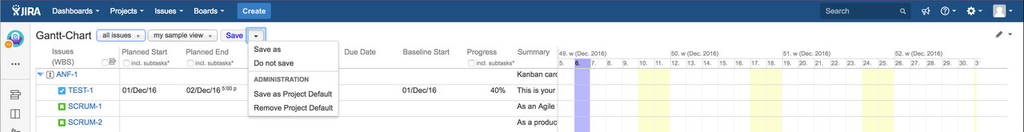
Having modified one of the provided/pre-defined views, you will only see "save as" instead of "save" (see above).
You can click on "save" and the current configured columns will be saved for your selected view. On the sub-menu, you can also select option "save as" to store current setting as a new view.
As administrator, you can additionally use option " Save as project's "Default View" " instead of using any specific view. Also, you can use option " Remove project's "Default View" " to revoke prior project configurations.
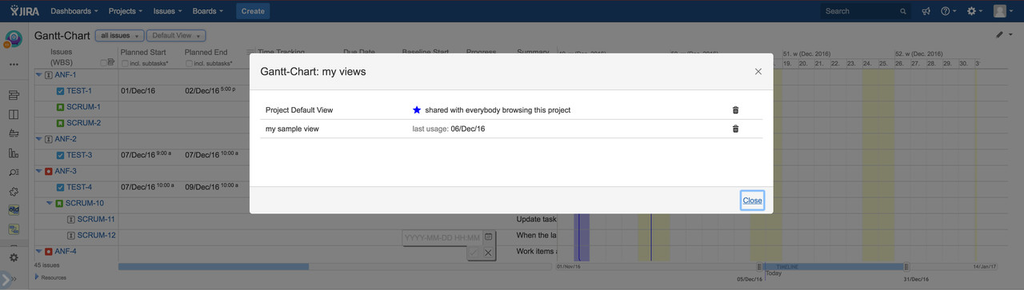
On view selection, if you click on menu item "Manage Views", you will get an overview of all configured views available for current user: clicking on the tray icon on the right, you can delete that view. Such operation cannot be reverted! For better information, date of last usage per view is also displayed.
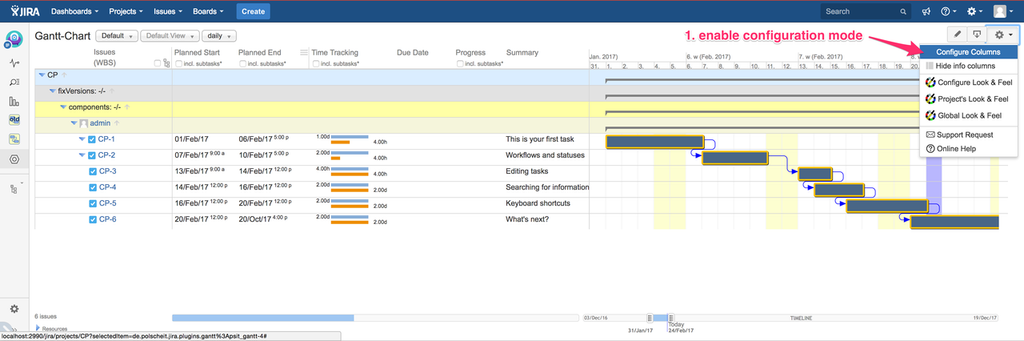
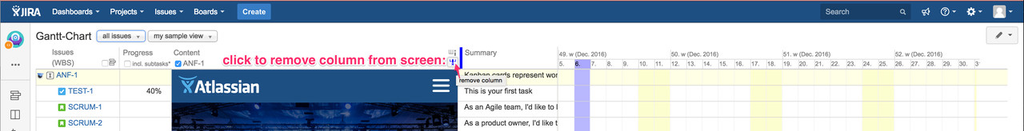
Remove column
Per view you can configure, which columns will be displayed: first, enable configuration-mode (click on the cog icon on the top right to open Gantt menu and click on item "configure columns"). Than move the mouse over the column, you want to remove from screen. Click on the "remove icon" (see screenshot below):
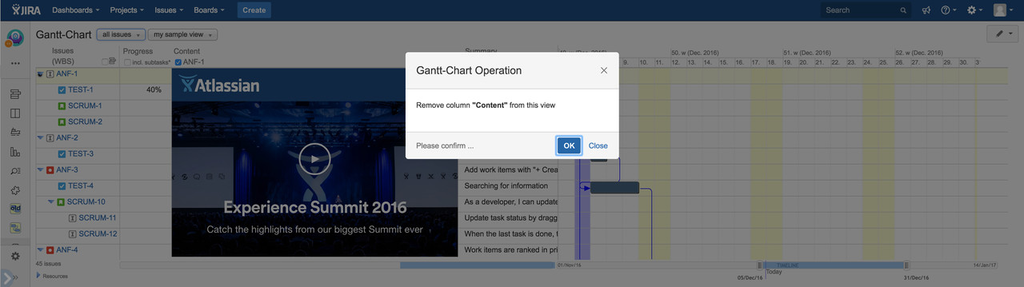
Afterwards, you have to confirm that remove-action:
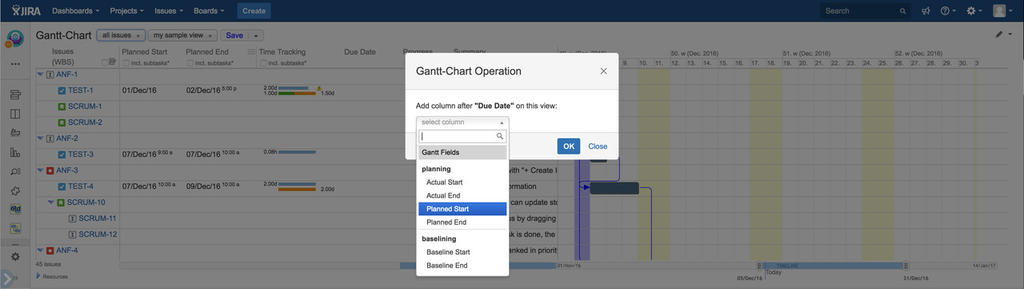
Add column afterwards
If you click on the "add column" icon above the "remove column" icon, you can select any column from the long list of provided fields: within the first section, you will see all Gantt-Chart related fields and all native JIRA fields including configured custom fields within the following section.
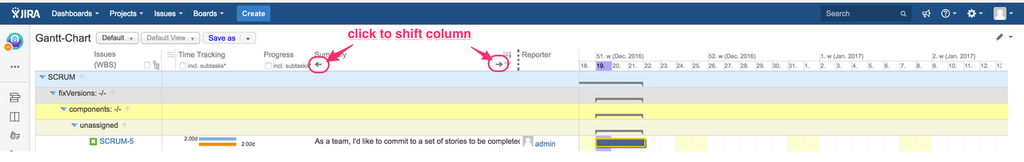
Shift column left/right
Since Gantt-Chart version 4.0.7.2 you can easily shift a column on the new Gantt Panel left or right by clicking on the related arrow-icons, having enabled configuration-mode:
Special rendering of columns within the information area of Gantt
URL custom fields (since Gantt-Chart v4.0.6)
If you have configured any custom field of JIRA's native field type "URL" (see sample screenshot below) and you put such custom field on the information area (first scrolling area on the left side of the Gantt diagram),
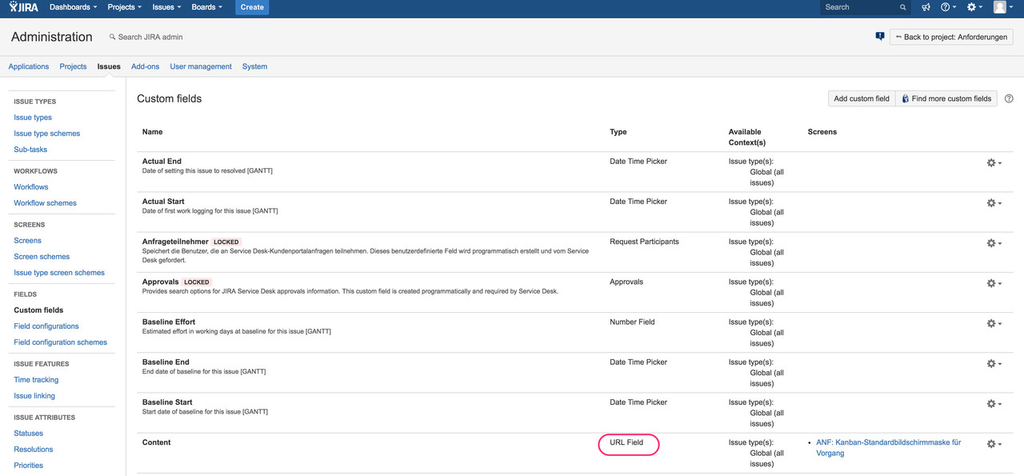
you will see its content as plain text as displayed below. Instead of any URL, that can be the URL of a related Confluence/wiki page as well:
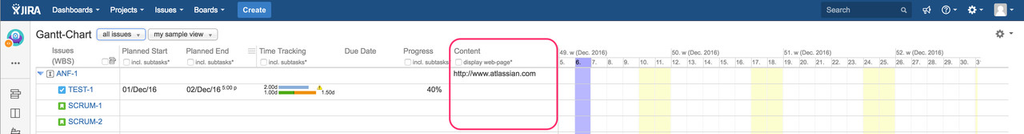
In order to embed the web page instead its URL, please enable option "display web-page" as second column header by clicking and also click on the row of the related issue, which content of that custom field should be displayed. By clicking anywhere within an issue's row, you'll mark that row.
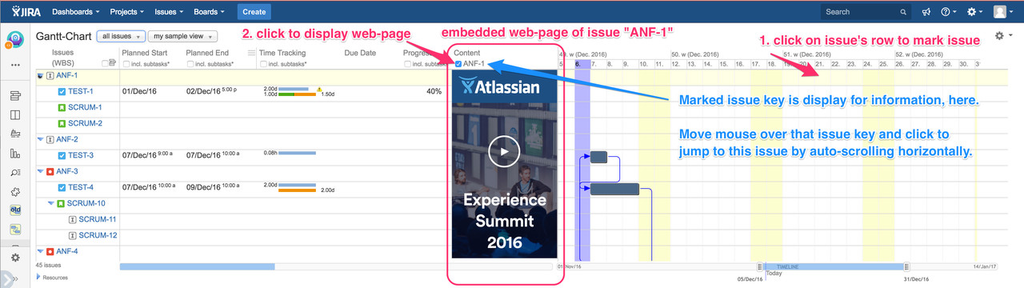
If you scroll horizontally, that embedded web-page will also scroll. It's width is related to the configured column width: use edit-mode to expand the width of that column if necessary. The embedded web-page is optimized to the visible size and will auto-expand to its max. width, which is the configured column width.
If you scroll vertically, the web-page will stay overlapping other issues' content until you change the marked issue to another one by clicking into another row.
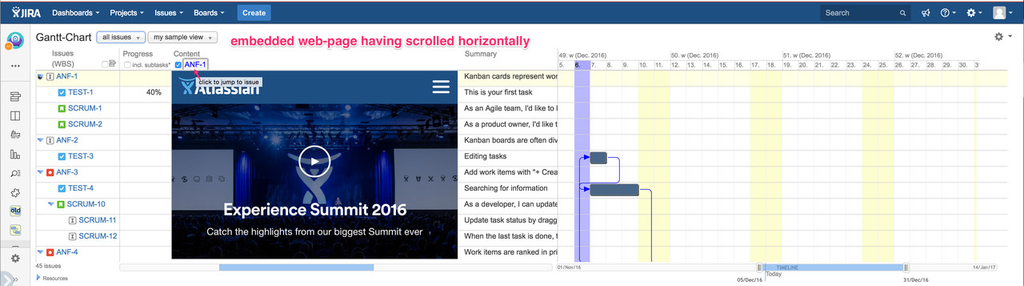
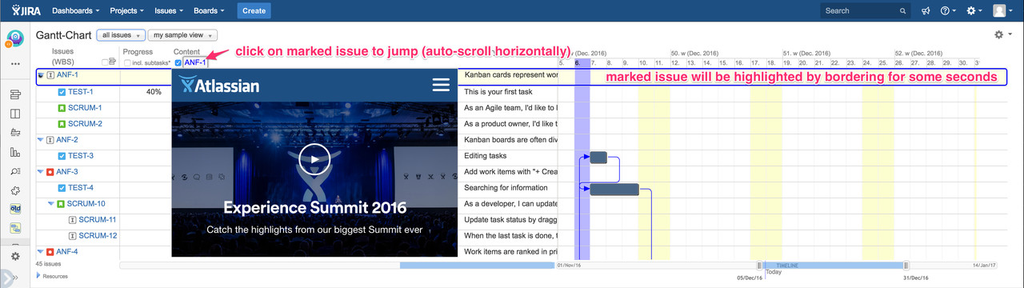
So, if you have scrolled up or down very far and want to directly jump to the marked issue, just click on the issue key being displayed as sub-header of the URL column. The Gantt Panel will auto-scroll vertically to display marked issue on screen: for better recognition, it's row will be bordered in blue for some seconds.
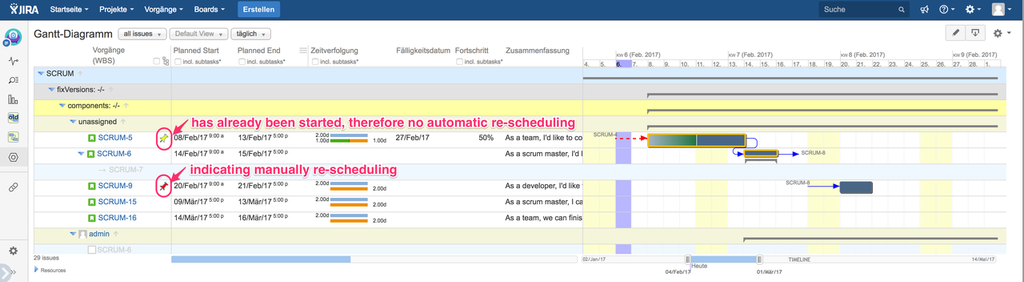
Re-scheduling indicators
A marker on the right side of an issue key indicates, if that issue has to be (re-)scheduled manually. If such issue has to be done after another issue (Gantt dependency "finish-start") and that prior issue will be re-scheduled, the dependent issue's planning dates will be kept unchanged in case of "manually re-scheduling". You can edit this by enabling edit-mode, move the mouse of the marker and set the occurring checkbox according to your needs.
Automatic re-scheduling while modifying original estimated effort
Having enabled re-scheduling for your project (globally within the add-on configuration or on the project's administration), modifying original estimated effort will automatically adjust the related planning dates (gantt bar) and all dependent issues:
| Please click on the video on the left side and play it. |
|---|
Interactive inline editing
Date- and DateTime-Fields
Using Gantt-Chart version 4.0.7.2 or later, you can interactively edit date and date-time fields on the information area of a Gantt Panel: enable edit-mode and move the mouse over the related cell to update its value. Having selected "Planning View", the edit-mode will be enabled by default: the pencil-icon on the right top will be displayed with a green background.
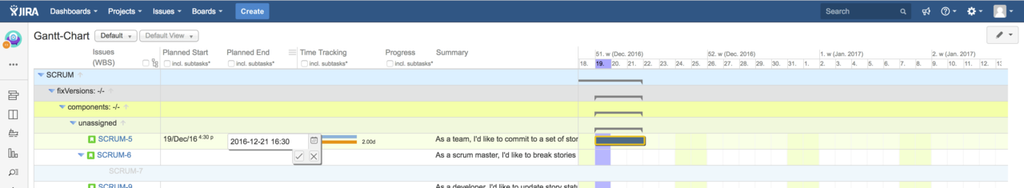
An existing value will be always displayed using format YYYY-MM-DD optional appended by HH:MM in case of datetime fields.
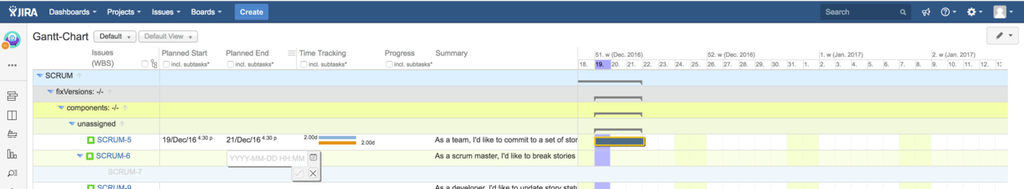
Syntax is checked to ensure valid input. If the new input is invalid, the okay button will be disabled automatically.
If you click on the small cal-icon on the right, you will get a calendar for fast date picking instead of typing.

If you have sorted the issues on the Gantt Panel (see above:![]() ) and have modified e.g planning dates, you will be ask if you want to re-sort all issues.
) and have modified e.g planning dates, you will be ask if you want to re-sort all issues.

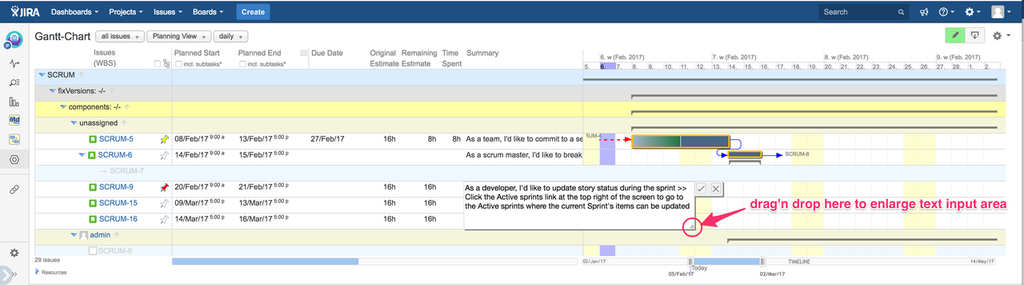
Text-Fields
Since Gantt-Chart version 4.0.9, you can also interactively edit any text field like issue summary.

Often, the text field may not be large enough: just click on the bottom right corner and resize by moving the mouse to e.g. enlarge.
User-Fields
Since Gantt-Chart version 4.0.9, you can also interactively edit any user field like assignee, reporter etc. assuming you have got the necessary JIRA permission for that. If that field is used within sorting, you can decide if you want to keep current order or to update like described above (see section above: Date- and DateTime-Fields).
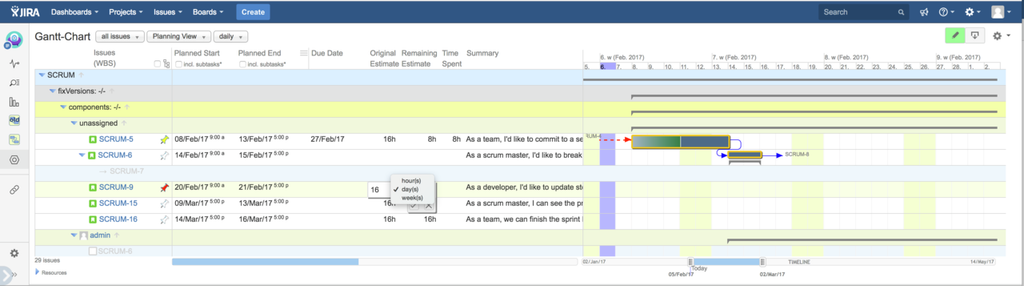
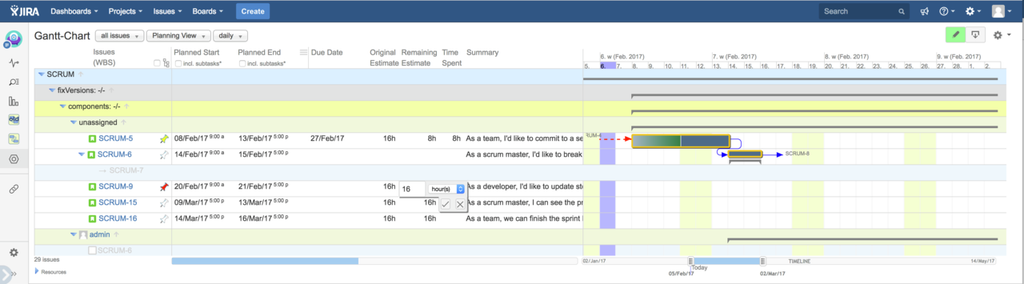
Original Estimated Effort
Since Gantt-Chart version 4.0.10, you can also interactively edit such fields: please select the unit via the selection on the right or just type in "h", "d" or "w" within the text-field to immediately switch the unit to "hours", "days" or "weeks" instead of select using the mouse. If re-scheduling has been enabled for this project (see project administration), changes of the original estimated effort will trigger re-scheduling of the related issue and all dependent issues: the planned end date will be adjusted for the issue.
Remaining Estimated Effort
Since Gantt-Chart version 4.0.10, you can also interactively edit such fields.
Marker for manually (re-)scheduling
Since Gantt-Chart version 4.0.10, you can also interactively edit such markers.
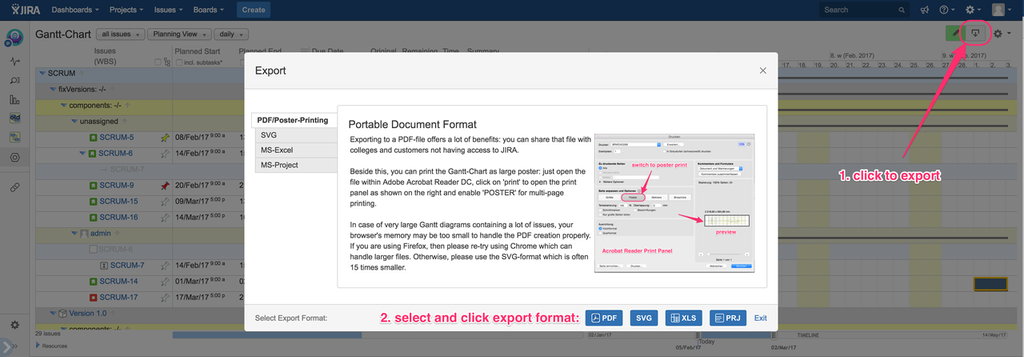
Exporting
Since Gantt-Chart version 4.0.8, a new export module is available on the Gantt Project Panel: please click on the export icon on the top right, then select your preferred format and click on the related button on bottom of the pop-up window as shown below.
Scalable Vector Graphic (SVG)
SVG is an XML-based vector image format for two-dimensional graphics. As XML files, SVG images can be created and edited with any text editor. Because SVG images are defined in XML format, they can be easily searched, indexed, scripted, and compressed. All major modern web browsers — including Mozilla Firefox, Internet Explorer, Google Chrome, Opera, Safari, and Microsoft Edge — have at least some degree of SVG rendering support. For editing and further processing, the use of the free open-source product INKSCAPE is recommended being available for Mircosoft Windows as well as Apple OSX and GNU/Linux.
Microsoft Office 2016 added support for importing and editing SVG images in January 2017.
Additional option fields for exporting:
- specify time range (from/to) or take over default (displayed min/max)
Portable Document Format (Adobe PDF)
Exporting to a PDF-file offers a lot of benefits: you can share that file with colleges and customers not having access to JIRA.
Additional option fields for exporting:
- specify time range (from/to) or take over default (displayed min/max)
Poster-Printing
Beside this, you can print the Gantt-Chart as large poster: just open the file within Adobe Acrobat Reader DC, click on 'print' to open the print panel as shown on the right and enable 'POSTER' for multi-page printing. In case of very large Gantt diagrams containing a lot of issues, your browser's memory may be too small to handle the PDF creation properly. If you are using Firefox, then please re-try using Chrome which can handle larger files. Otherwise, please use the SVG-format which is often 15 times smaller.
Microsoft Excel
Due to best compatibility, the common file format XLS is used instead of the newer XSLX. Alternative spread-sheet applications like "Numbers", (c) by Apple Inc., are also able to open such files.
The exported columns are statically defined by the add-on and do not take care about the configured columns by the user. Within future versions, this may change.
Timelines cannot be represented within Excel in a suitable way, so that all necessary raw data are exported including grouping to reflect the issue hierarchy keeping the work-breakdown-structure.

Microsoft Project
Most features are identical, but quite a lot of are different: e.g. JIRA issues can only be assigned to one user whereas MS-Project allows assignment to multiple resources, a summary task within JIRA may have got its own estimated efforts etc.
Instead of MPP file format, Microsoft's newer XML format for MS-Project is used for simplicity as well as human readability in case of checking data.
If you have any suggestions, feedback or demands, please do not hesitate to contact me at frank@polscheit.de