...
- if you use loading by scrolling down, the assignee's utilization will be calculated and displayed reaching another assignee or end of issue selection (otherwise, you would aggregate incomplete list of issues resulting in wrong numbers)
- if you use loading at once/initial loading, all assignee's utilization will be aggregated and displayed immediately
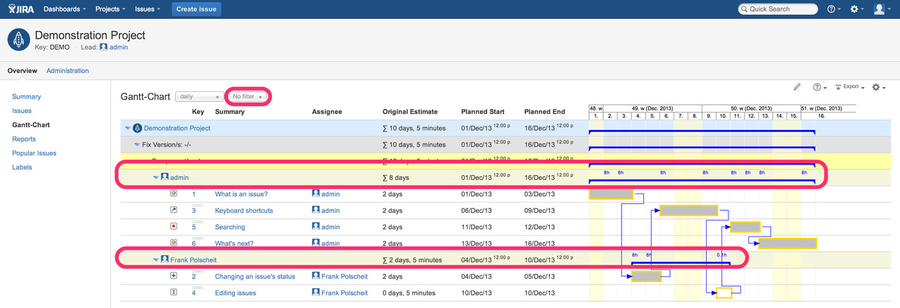
- in blue color at the top of each row, you will see the aggregated sum of estimated efforts per time unit (daily, weekly, monthly, quarterly, yearly), whereas you will see the aggregated sum of remaining estimated efforts at the bottom in black color or in red, if the related daily amount of working hours has been exceeded. The daily amount of working hours can be configured within JIRA natively (see Atlassian docu).
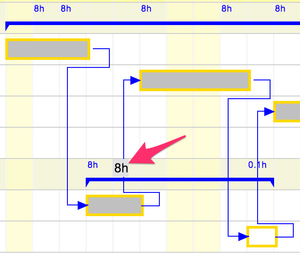
The utilization figures are rounded to one digit after the comma – if necessary – and displayed using a font size of 10px:
if that's to small to be read comfortably, move the mouse over the related figure and the number will be enlarged automatically for better readability
The utilization figures above the blue grouping line indicate sum of average planned effort per time unit over all issues of that assignee, whereas the figures below indicates the sum of average remaining estimated efforts per time unit, e.g. daily, weekly or monthly etc.
4. You can easily (re-)assign issues to other team members: ensure that you have configured the Gantt-Chart to display the assignee column (Gantt menu - configure columns & rows - tab "columns") and that you have enabled edit mode by clicking on the pencil icon (1). Then click on the assignee field (2) rather than by drag'n drop:
...